Apple and Sony Earn Top Customer Experience Ratings for Software Makers

Temkin Experience RatingsWe recently released the 2017 Temkin Experience Ratings that ranks the customer experience of 331 companies across 20 industries based on a survey of 10,000 U.S. consumers.

Apple and Sony deliver the best customer experience in the software industry, according to the 2017 Temkin Experience Ratings.

See our FAQs about the Temkin Experience Ratings.

Report: Tech Vendors: Product and Relationship Satisfaction, 2017

1701_ds_techproductsandrelationships_coverWe just published a Temkin Group data snapshot, Tech Vendors: Product and Relationship Satisfaction of IT Clients, 2017.

During Q3 of 2016, we surveyed 800 IT decision-makers from companies with at least $250 million in annual revenues, asking them to rate both the products of and their relationships with 62 different tech vendors. HPE outsourcing, Google, and IBM SPSS earned the top overall scores, while Trend Micro, Infosys, and SunGard received the lowest overall scores. To determine their product rating, we evaluated tech vendors across four product/service criteria: features, quality, flexibility, and ease of use. And we calculated their relationship rating using four different criteria: technical support, support of the account team, cost of ownership, and innovation of company. We also looked at how the average product and relationship scores of tech vendors have changed over the previous three years.

This research has a report (.pdf) and a dataset (excel). The dataset has the details of Product/Service and Relationship satisfaction for the 62 tech vendors as well as for several tech vendors with sample sizes too small to be included in the published report.

Download report for $495
(includes Excel spreadsheet with data)
BuyDownload3

Here’s a link to last year’s study.

The research examines eight areas of satisfaction; four that deal with products & services and four that examine relationships. Tech vendors earned the highest average satisfaction level for product features (64%) and the lowest for total cost of ownership (57%).

As you can see in the chart below, the overall product/service & relationship satisfaction ranges from a high of 76% for HPE outsourcing down to a low of 42% for Trend Micro.

1701_techproductrelationshipoverallresults

Read more of this post

Report: Tech Vendor NPS Benchmark, 2016 (B2B)

1609_technpsbenchmark_coverWe just published a Temkin Group report, Tech Vendor NPS Benchmark, 2016, The research examines Net Promoter Scores and the link to loyalty for 62 tech vendors based on feedback from 800 IT decision makers in large North American organizations. We also compared overall results to our benchmarks from the previous four years. Here’s the executive summary:

For the fifth year in a row, we examined the link between Net Promoter Scores® (NPS®) and loyalty for technology vendors. We surveyed 800 IT decision-makers from large North American firms to learn about their relationships with their technology providers. Of the 62 tech vendors we evaluated, IBM, HPE outsourcing, IBM SPSS, and VMware earned the highest NPS, while Cognizant, Capgemini, and Infosys received the lowest. Overall, the average NPS for the tech vendor industry decreased by almost 2 percentage points from last year. Our analysis shows that promoters are much more likely than detractors to increase their spending with tech vendors, try new products and services when they are announced, and forgive tech vendors after a bad experience. We also found that Software AG and HPE outsourcing are the top companies for purchase momentum, while IBM SPSS, IBM software, and IBM outsourcing have the highest Temkin Innovation Equity Quotient, and HPE outsourcing and IBM SPSS are at the top of the Temkin Forgiveness Ratings.

The report includes graphics with data for NPS, purchase intentions, likelihood to forgive, and likelihood to try a new offering. The excel spreadsheet includes this data (in more detail) for the 62 companies as well as for other tech vendors with less than 40 pieces of feedback. It also includes the summary NPS scores from 2015.

Download report for $695
(includes Excel spreadsheet with data)
BuyDownload3

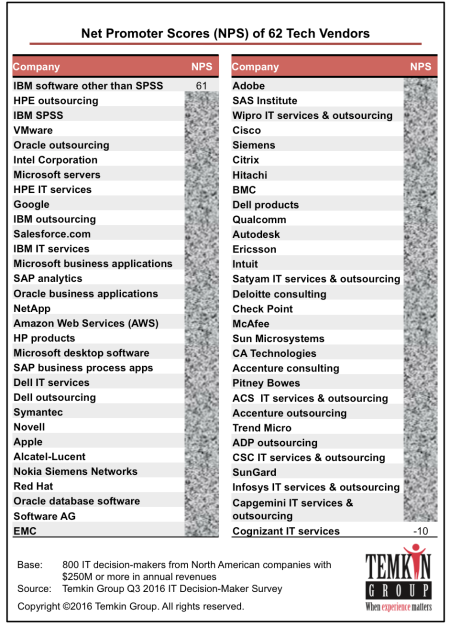
As you can see in the chart below, the NPS ranges from a high of 61 for IBM software down to  a low of -10 for Cognizant IT services.

1609_techvendornpsclear

The industry average NPS decreased to 29.9 this year. The research also includes data for Purchase Momentum (how much customers are planning to buy), Temkin Forgiveness Ratings (likelihood of customers to forgive after a bad experience), and Temkin Innovation Equity Quotient (likelihood of customer to try a new offering). We not only list the results for each company, but we also show that NPS is highly correlated to each of these items (as you can see below for Purchase Momentum).

1609_techvendornpstrendandcorrelatoin

Report details: When you purchase this research, you will receive a written report and an excel spreadsheet with more data. The report includes graphics with data for NPS, purchase momentum, Temkin Forgiveness Ratings, and Temkin Innovation Equity Quotient for the 62 tech vendors that had at least 40 pieces of feedback. The excel spreadsheet includes this data (in more detail) for the 62 companies as well as for other tech vendors with less than 40 pieces of feedback. It also includes the summary NPS scores from 2015. If you want to know more about the data file, download this SAMPLE SPREADSHEET without the data (.xls).

Download report for $695
(includes Excel spreadsheet with data)
BuyDownload3

Note: See our 2015 NPS benchmark2014 NPS benchmark2013 NPS benchmark and 2012 NPS benchmark for tech vendors as well as our page full of NPS resources.

P.S. Net Promoter Score, Net Promoter, and NPS are registered trademarks of Bain & Company, Satmetrix Systems, and Fred Reichheld.

Google and Symantec Earn Top Customer Experience Ratings for Software Firms

Temkin Experience Ratings

We recently released the 2016 Temkin Experience Ratings that ranks the customer experience of 294 companies across 20 industries based on a survey of 10,000 U.S. consumers.

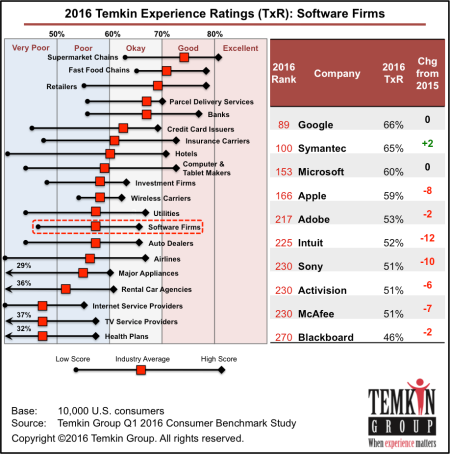
Of the 10 software firms we looked at, Google earned the highest score for the second year in a row with a rating of 66%, putting it in 89th place overall out of 294 companies across 20 industries. Symantec came in a close second with a rating of 65% and a rank of 100th overall. Additionally, Symantec was the only software firm to improve its rating between 2015 and 2016, increasing by two percentage points.

1605_Software_Rank

Read more of this post

Report: Tech Vendors: Product and Relationship Satisfaction, 2016

1601_DS_TechProductsAndRelationships_COVERWe just published a Temkin Group data snapshot, Tech Vendors: Product and Relationship Satisfaction of IT Clients, 2016.

During Q3, 2015, 800 IT professionals from companies with at least $250 million in annual revenues rated both the products of and their relationships with 62 tech vendors. The research examines satisfaction with eight areas: product/service features, product/service quality, product/service flexibility, product/service ease of use, technical support, support of the account team, cost of ownership, and innovation of company. Some of the findings include that Intel, Google, and HP outsourcing earned the highest overall satisfaction ratings, while Unisys, Sage, and Cognizant IT services earned the lowest. When it comes to product satisfaction, Intel leads in product features, Apple and IBM IT services lead in product quality, Google leads in product flexibility, and NetApp leads in product ease of use. When it comes to relationship satisfaction, HP outsourcing leads in tech support and in cost of ownership, Intel leads in account team support, and Google leads in innovation.

This product has a report (.pdf) and a dataset (excel). The dataset has the details of Product/Service and Relationship satisfaction for the 62 tech vendors as well as for several tech vendors with sample sizes too small to be included in the published report.

Download report for $495
(includes Excel spreadsheet with data)
BuyDownload3

As you can see in the chart below, the overall product/service & relationship satisfaction ranges from a high of 74% for Intel down to a low of 46% for Unisys.

1601_ProductRelationshipSatisfaction_Ratings

The chart below shows the average scores across all satisfaction criteria. Tech vendors scored the highest in innovation (64%) and the lowest in cost of ownership (56%).1601_ProductRelationshipSatisfaction_Elements

Report details: When you purchase this research, you will receive a written data snapshot and an excel spreadsheet with more data.The dataset has the details of Product/Service and Relationship satisfaction for the 62 tech vendors as well as for several tech vendors with sample sizes too small to be included in the published report. If you want to know more about the data file, download this SAMPLE SPREADSHEET without the data (.xls).

Download report for $495
(includes Excel spreadsheet with data)
BuyDownload3

Report: Tech Vendor NPS Benchmark, 2015 (B2B)

1509_IT_NPSBenchmark_COVERWe just published a Temkin Group report, Tech Vendor NPS Benchmark, 2015, The research examines Net Promoter Scores and the link to loyalty for 62 tech vendors based on feedback from IT decision makers in large North American organizations. We also compared overall results to our benchmarks from the previous three years. Here’s the executive summary:

To examine the link between Net Promoter Scores® (NPS®) and loyalty, we surveyed 800 IT decision-makers from large North American firms to learn about their relationships with their technology providers. Of the 62 tech vendors we evaluated, SAS Institute, HP outsourcing, and Intel earned the highest NPS, while Accenture, CA Technologies, and Hitachi received the lowest. Overall, the tech vendor industry’s average NPS jumped to 31.8 in 2015—an increase of more than eight points—after two straight years of declining scores. Our analysis shows that promoters are much more likely than detractors to spend more money with tech vendors, try new products and services when they are announced, and forgive their tech vendors after a bad experience. Our results also revealed that SAS Institute and Cognizant outsourcing were the top companies for purchase momentum, IBM SPSS and Intel have the highest Temkin Innovation Equity Quotient, and HP outsourcing and Intel scored the highest in the Temkin Forgiveness Ratings.

The report includes graphics with data for NPS, purchase intentions, likelihood to forgive, and likelihood to try a new offering. The excel spreadsheet includes this data (in more detail) for the 62 companies as well as for 25 other tech vendors with less than 40 pieces of feedback. It also includes the summary NPS scores from 2014.

Download report for $695
(includes Excel spreadsheet with data)
BuyDownload3

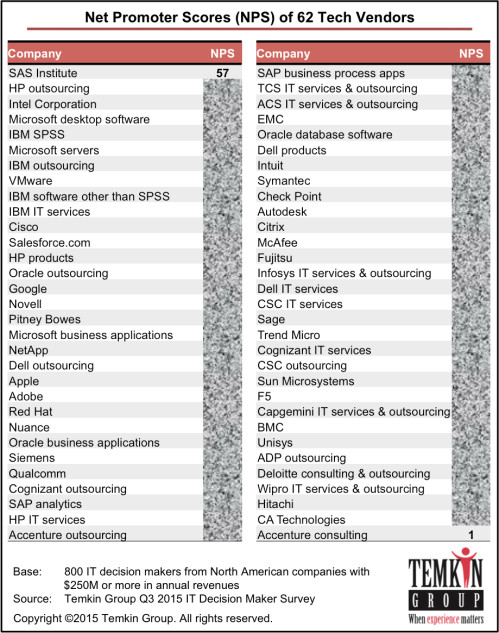
As you can see in the chart below, the NPS ranges from a high of 57 for SAS Institute down to  a low of 1 for Accenture consulting.

1509_TechNPS_Listing

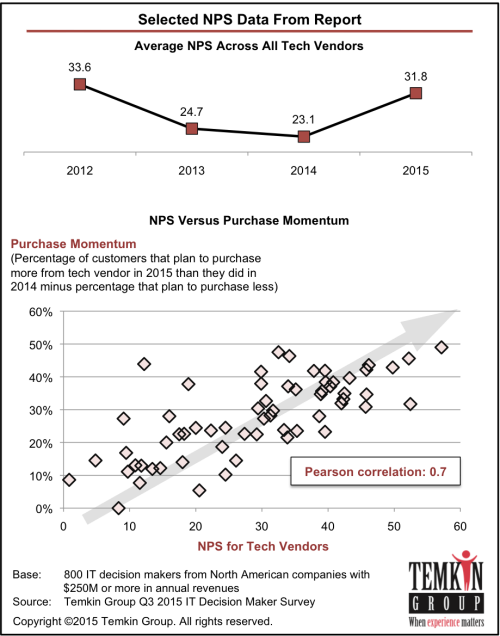
After declining for the past two years, the industry average NPS increased to 31.8 this year, almost reaching the level from our initial study in 2012. The research also includes data for Purchase Momentum (how much customers are planning to buy), Temkin Forgiveness Ratings (likelihood of customers to forgive after a bad experience), and Temkin Innovation Equity Quotient (likelihood of customer to try a new offering). We not only list the results for each company, but we also show that NPS is highly correlated to each of these items (as you can see below for Purchase Momentum).

1509_TechNPS_TrendPurchase

Report details: When you purchase this research, you will receive a written report and an excel spreadsheet with more data. The report includes graphics with data for NPS, purchase momentum, Temkin Forgiveness Ratings, and Temkin Innovation Equity Quotient for the 62 tech vendors that had at least 40 pieces of feedback. The excel spreadsheet includes this data (in more detail) for the 62 companies as well as for 25 other tech vendors with less than 40 pieces of feedback. It also includes the summary NPS scores from 2014. If you want to know more about the data file, download this SAMPLE SPREADSHEET without the data (.xls).

Download report for $695
(includes Excel spreadsheet with data)
BuyDownload3

Note: See our 2014 NPS benchmark2013 NPS benchmark and 2012 NPS benchmark for tech vendors as well as our page full of NPS resources.

P.S. Net Promoter Score, Net Promoter, and NPS are registered trademarks of Bain & Company, Satmetrix Systems, and Fred Reichheld.

Apple and Google Lead Software Industry in Customer Experience

We recently released the 2015 Temkin Experience Ratings that ranks the customer experience of 293 companies across 20 industries based on a survey of 10,000 U.S. consumers.

Here are some highlights from the Ratings for software firms:

  • Apple and Google tied for the highest score in the software industry, each scoring 66% and ranking 136th overall. Apple’s score declined by two percentage-points from last year, while Google’s increased by one point.
  • Blackboard dropped seven points between 2014 and 2015—from 54% last year to 47% this year—making it the lowest ranked software company for the second year in a row. It was also the only software company to score a “very poor” rating.
  • Blackboard received the lowest TxR component ratings in all three categories, falling more than 10 percentage-points below the industry average in each one. It fell 10.2 points below industry average in success, 14.5 points below industry average in effort, and 14.1 points below industry average in emotion.
  • The average rating for software firms dropped 2.4 percentage-points in the last year, down from 63% in 2014 to 60% in 2015.
  • In addition to the overall rating, the average score of each component decreased between 2014 and 2015. In 2014 the industry average for success was 68%, now it is 66%. Likewise, the average score for effort dropped from 65% to 63%, and the average score for emotion dropped from 55% to 53%.
  • Apple earned the highest score for both the success and emotion components, scoring 72% and 60% respectively. Google, meanwhile, scored the highest for the effort component with 70%.
  • Google and Intuit were the only two software firms to have increased their score over the past year; however, each only improved by one percentage-point. Google went from 65% to 66% over the past year, and Intuit went from 63% to 64%.
  • Although Activision fell below the industry average for both the success and effort component, it scored 2.4 percentage-points higher than the industry average for the emotion component. Sony, on the other hand, scored above industry average for both effort and emotion, but scored 2.9 percentage-points below average for the success component.

Read more of this post

Report: Tech Vendor NPS Benchmark, 2014

1407_IT_NPSBenchmark_COVERWe just published a Temkin Group report, Tech Vendor NPS Benchmark, 2014, The research examines Net Promoter Scores and the link to loyalty for 63 tech vendors based on feedback from IT decision makers. We also compared overall results to our 2013 NPS benchmark and our 2012 NPS benchmark. Here’s the executive summary:

We surveyed IT decision-makers from more than 800 large North American firms to learn about their relationships with their tech vendors. We asked them a series of questions regarding their experiences as the clients of different tech vendors, and one of the questions we posed generated Net Promoter Scores® (NPS®) for the companies. Of the 63 companies we looked at, EDS and VMware earned the highest NPS, while Autodesk and Cognizant received the lowest. The overall industry average NPS dropped for the second year in a row. Our analysis also delved into the correlation between NPS and loyalty, revealing that, compared to severe detractors, promoters are much more likely to spend more money with their tech vendors in 2014, try new products and services when they are announced, and forgive the vendor for a mistake. We compared the loyalty levels for each vendor, and we found that SunGard and IBM software have the most customers planning on increasing their purchases in 2014, while Satyam and EDS customers are the most willing to try new offerings, and Satyam has the most forgiving customers. Our research also shows that promoters are more concerned than detractors about getting lower prices.

Download report for $695 (includes Excel spreadsheet with data)
BuyDownload3

This is the third year that Temkin Group has completed the NPS study. Over that time, the average NPS in the tech industry has been dropping. NPS in for tech vendors was 33.6 in 2012 and 24.7 in 2013, falling to 23.1 in 2014.

With an NPS of 48, EDS came out with the top score followed closely by VMware with 45. Six other tech vendors received NPS of 35 or more: EMC, Microsoft servers, Oracle outsourcing, Pitney Bowes, Microsoft business applications, and Cisco.

At the other end of the spectrum, three tech vendors have negative NPS: Autodesk, Cognizant, and Wipro. Six other vendors fell below 10: Capgemini, Intuit, ADP outsourcing, CA, Infosys, and HP outsourcing.

1407_ITNPS_Companies

The report also examines the link between NPS and loyalty. Our analysis shows that promoters are more than six times likely to forgive a tech vendor if they deliver a bad experience, about seven times as likely to try a new offering from the company, and almost three times as likely to purchase more from them in 2014 than they did in 2013.

In addition to benchmarking NPS, the research measures the loyalty that large companies have for their tech vendors. Respondents have the most plans to increase spending with SunGard, IBM software, Alcatel-Lucent, and ACS. They are most likely to try new offerings from Satyam, EDS, and EMC. And if the tech vendors make a mistake, IT decision makers are most likely to forgive Satyam, EDS, Ericsson, and Alcatel-Lucent. NPS characterizes respondents as Promoters when they are very likely to recommend and Detractors when they are very unlikely to recommend.

Report details: The report includes graphics with data for NPS, 2014 purchase intentions, likelihood to forgive, likelihood to try a new offering, and areas of improvement for the 63 tech vendors that had at least 40 pieces of feedback. The excel spreadsheet includes this data (in more detail) for the 63 companies as well as for 22 other tech vendors with less than 40 pieces of feedback. It also includes the summary NPS scores from 2013. If you want to know more about the data file, download this excel spreadsheet without the data.

Download report for $695 (includes Excel spreadsheet with data)
BuyDownload3

The bottom line: When it comes to NPS, large tech vendors are heading in the wrong direction

Note: See our 2013 NPS benchmark and 2012 NPS benchmark for tech vendors as well as our page full of NPS resources.

P.S. Net Promoter Score, Net Promoter, and NPS are registered trademarks of Bain & Company, Satmetrix Systems, and Fred Reichheld.

Amazon Provides Best Technical Support

We examined the service and support delivered by the following technology providers:

  • Amazon (e.g., Kindle, Kindle Fire, Kindle Fire HD, Amazon Prime)
  • Apple (e.g., iPhone, iPad, iTunes, iCloud, MacBook)
  • Google (e.g., Search, Google Docs, Gmail, YouTube, Google Play, Google Drive)
  • Sony (e.g., PlayStation 3, PlayStation 4)
  • Microsoft (e.g., XBOX, WINDOWS, MSOffice, and Skype)
  • Nintendo (e.g., Wii, Wii U)
  • Samsung (e.g., Galaxy Phones, Galaxy Tablets, Galaxy Note)

We asked consumers who had recent service or support experience to rate those vendors in two areas:

  1. Thinking about your recent customer service or technical support experience from these companies, how would you rate the end-to-end experience from your first attempt to get help until your issue was resolved?
  2. How would you rate the overall quality of online resources provided by these companies for end user support (e.g., websites, chat, contact us, FAQs)?

As you can see in the graphic below, less than half of consumers rated any of the companies “excellent.” Some other tidbits:

  • Amazon.com is on top for end-to-end service as well as for its online resources.
  • Apple provides the second best end-to-end service, but the worst online resources.
  • Google is next to the bottom in both categories.
  • Microsoft is the lowest scoring for end-to-end service, but third from the bottom for its online resources.

1407_TechSupport1

The bottom line: Consumers could use better support for their technology.

Nadella Pushes Microsoft to Rediscover Its Soul

In a letter to all Microsoft employees called Starting FY15 – Bold Ambition & Our Core, CEO Satya Nadella established a mandate and vision for significant change across the technology behemoth.

Microsoft has great assets, but it has not kept up with changes in how people use technology. The Redmond giant was becoming increasingly less relevant in a world where digital technology is becoming more relevant.

Microsoft has needed to change for a while. There’s a saying that the best time to plant a tree is ten years ago and the second best time is right now. Nadella has made it clear that Microsoft’s time for change is right now.

My take: First of all, it’s hard to talk about any large-scale culture change without recommending that people review our model called Employee-Engaging Transformation, which is built on five practices: Vision Translation, Persistent LeadershipActivated Middle ManagementGrassroots Mobilization and Captivating Communications.

EET2

We work with many of the world’s leading technology companies, so I could go on and on about what changes are necessary at Microsoft. But I’d rather examine broader lessons from Nadella’s letter. Here are some excerpts that I thought were particularly valuable to discuss:

“...in order to accelerate our innovation, we must rediscover our soul – our unique core

Successful companies almost always start with a strong raison d’être, but it can get lost as the company grows and the world changes (see my post on Starbucks). Without a “soul,” companies drift along as employees across the organization start operating in a disconnected way. This is where the brand comes in. Companies need to constantly refresh their brands and make sure that the brand drives decisions across the organization (see my post on Walmart).

More recently, we have described ourselves as a “devices and services” company. .. At our core, Microsoft is the productivity and platform company for the mobile-first and cloud-first world. We will reinvent productivity to empower every person and every organization on the planet to do more and achieve more.”

Our research shows that employees are more productive and engaged when they are inspired by their organization’s mission. Which one of these statements do you think is more inspiring: “We are the devices and service company” or “We will reinvent productivity to empower every person and every organization on the planet to do more and achieve more.”

“We will create more natural human-computing interfaces that empower all individuals.”

This is a comment about technology, but its also points to a broader commentary about making things easy to use. We have entered into a world where people have more options, more distraction, and less patience. Every organization needs to relentlessly focus on making their products, services, and processes easier for customers to use.

Obsessing over our customers is everybody’s job. I’m looking to the engineering teams to build the experiences our customers love.

What’s not to love about this excerpt. My customer experience manifesto (and Temkin Group, for that matter) is built on a fundamental belief that sustaining great customer experience is not about applying a veneer, but about building competencies across the entire organization that create great experiences for customers (see our four CX core competencies). Also, it’s interesting that Nadella used the word “love.” Experiences are made up of three component (functional, accessible, and emotional) and our Temkin Experience Ratings show that companies are weakest at driving the emotional component. To get people to “love” your company, I suggest applying what we call People-Centric Experience Design.

“I am committed to making Microsoft the best place for smart, curious, ambitious people to do their best work.”

One of the Six Laws of Customer Experience is that unengaged employees can’t create engaged customers. Any company looking to improve how it interacts with customers almost certainly needs to focus on its employees.

“We will be more effective in predicting and understanding what our customers need and more nimble in adjusting to information we get from the market.”

How companies use customer insights is changing rapidly. Technologies such as text analytics and predictive analytics are helping companies tap into more comprehensive and ongoing insights, rather than relying on periodic customer surveys. Ultimately, companies will need to reinvent their operating frameworks so that they can adjust more frequently to take advantage of these rapidly-flowing insights.

Nothing is off the table in how we think about shifting our culture to deliver on this core strategy.”

This type of statement only works if it’s backed up by clear actions that employees can observe. These “symbols” of change need to be clear departures from how the company operated in the past, and can include reorganizations, firings/hirings/promotions/demotions, killing projects, accelerating projects, etc.). Don’t just say change is coming, demonstrate it (see the 3 characteristics of transformational leaders).

“We must each have the courage to transform as individuals. We must ask ourselves, what idea can I bring to life? What insight can I illuminate? What individual life could I change? What customer can I delight? What new skill could I learn? What team could I help build? What orthodoxy should I question?”

The notion of a personal challenge is a great way to help employees think about how they can be (and must be) a part of the change. But the questions won’t be too powerful if they are just statements in a letter from the CEO. Use these questions as part of discussions across the organization and embed them into leadership training and competency models.

 The bottom line: Change isn’t easy, but Microsoft seems ready to give it a try.

Symantec and Apple Lead Software Industry in 2014 Temkin Experience Ratings

We recently released the 2014 Temkin Experience Ratings that ranks the customer experience of 268 companies across 19 industries based on a survey of 10,000 U.S. consumers.

Symantec took the top spot for the first time ever, earning a 69% rating and landing in 102nd place overall out of 268 companies across 19 industries. Apple came in a very close second with a rating of 68% and an overall rank of 109th. While Symantec ascended from its 2013 position in the middle of the group, Apple maintained its second-place rank from last year. Meanwhile, at the bottom of the list, Blackboard’s ranking dropped dramatically, leaving it in last place with a rating of 54% and an overall ranking of 241st.

Download entire dataset for $395

SOftwareA
Here are some additional findings from the software industry: Read more of this post

Report: What Happens After a Good or Bad Experience, 2014

1402_WhatHappensAfterGoodBadExperiences_COVERWe just published a Temkin Group report, What Happens After a Good or Bad Experience, 2014. The report, which includes 19 data charts, examines which companies and industries provide the most bad experiences, what impact those experiences have on spending, and how the negative impacts of bad experiences can be mitigated by good service recovery. The report also examines how consumers share their good and bad experiences with companies as well as with other people. Here’s the executive summary:

To understand the effect of good and bad experiences, we asked 10,000 U.S. consumers about their recent interactions with 268 companies across 19 industries. Results show that Internet services and TV services are the industries most likely to deliver a bad experience to their customers, while grocery chains are the least likely to. At the company level, Scottrade had the smallest percentage of customers reporting a recent bad experience with the company and Time Warner Cable had the highest. More than half of the customers who encountered a bad experience at a fast food chain, credit card issuer, grocery store, or hotel either decreased their spending with the company or stopped altogether. However, our data shows that a good service recovery effort can help mitigate a bad experience. Unfortunately, many firms—especially in the banking, Internet services, and TV services sectors—aren’t very good at service recovery. In addition to the consequences of bad interactions, we also examined which channels customers use to share their good and bad experiences and how these changed across age groups. We then compared these results to survey responses from the past two years. We also uncovered a negative bias inherent in how customers provide feedback. ING Direct, Residence Inn, and Fairfield Inn have the most negative bias in the feedback they receive directly from customers, while Hy-Vee and Hyundai have the most negative bias on Facebook. 

Click link to see full list of industries and companies covered in this report (.pdf).

Download report for $195
BuyDownload3

One of the most interesting analyses in the report is the look at how service recovery after a bad experience affects the spending pattern of consumers. Here’s a summary of one of the charts showing just how important it is for a company to recover well after making a mistake:
1402_EconomicsOfServiceRecovery

Here are some other insights from the research:

  • Sixteen percent of consumers who have interacted with TV service and Internet service providers report having a bad experience over the previous six months. Next on the list are wireless carriers, with 12% of their customers reporting a bad experience. At the other end of the spectrum, only 3% of consumers report a bad experience with grocery chains and 4% report having a bad experience with fast food chains.
  • The five companies with the most customers reporting bad experiences are Time Warner Cable (25%), Motel 6 (22%), Coventry Health Care (21%), and Comcast (21%). There were 10 companies with only 1% or less of their customers reporting bad experiences: Scottrade, Chick-fil-A, H.E.B., Whole Foods, ShopRite, ING Direct, Starbucks, Trader Joe’s, Vanguard, and True Value.
  • More than one-quarter of consumers who have a bad experience stop spending with computer makers, car rental agencies, credit card issuers, hotel chains, and software companies. The impact of bad experiences is less costly for parcel delivery services, wireless carriers, health plans, TV service providers, Internet service providers, and grocery chains, as less than 15% of their customers with bad experience stopped spending.
  • The industries that are the best at responding to a bad experience are investment firms, major appliances, retailers, and car rental agencies. The industries that are the worst at responding to a bad experience are TV service providers, wireless carriers, Internet service providers, parcel delivery services, and health plans.
  • Thirty-two percent of consumers give feedback directly to companies after a very bad experience and 23% give feedback after a very good experience.
  • Overall, 25- to 34-year-olds are the most likely to share feedback about their experiences. After a good experience 57% tell a friend directly, 28% share on Facebook, and 18% put a comment or rating on a review site. After a bad experience, 60% tell a friend directly, 31% share on Facebook, and 20% write a review.

Download report for $195
BuyDownload3

The bottom line: Make sure to recover quickly after a bad experience

50 CX Tips: eBook and Infographic

1310_50CXTips_COVERI recently completed a series of 50 customer experience (CX) tips. To make it easier for people to read and download all of the tips, I assembled them into a free eBook: 50 CX Tips: Simple Ideas, Powerful Results.

Each of the 50 CX Tips is aligned with one or more of Temkin Group’s four customer experience core competencies: Purposeful Leadership, Compelling Brand Values, Employee Engagement, and Customer Connectedness.

The CX Tips include examples from a wide variety of companies including Adobe, Amazon.com, Apple, BCBS of Michigan, Becker and Poliakoff, Big Lots, BMO Financial Group, Bombardier Aerospace, CDW, Charles Schwab, Citrix, Disney, EMC, Fidelity Investments, Hampton Inn, Hilton, IBM, Intersil, Intuit, JetBlue, Microsoft, Oklahoma City Thunder, Oracle, Safelite AutoGlass, Salesforce.com, SanDIsk, SimplexGrinnell, Southwest Airlines, Sovereign Assurance of NZ, Sprint, Starbucks, Stream Global Services, Sam’s Club, USAA, VMware, and ZocDoc.

While you may have a hard time applying all 50 CX TIps, you should be able to identify several that will work for your organization. I challenge you to select three or more of the CX Tips to implement. Here’s an idea: Have each of your team members pick the five CX Tips that they think would be the most powerful for your organization. Use a team meeting to discuss everyone’s selections and pick the ones you want to implement.

We also created an infographic with the 50 CX tips. Here’s a version with the top 10 CX tips (click on the graphic to get a .pdf of the full infographic).

Top10CXTips_TemkinGroupThe bottom line: A handful of CX Tips can propel your customer experience.

Tech Vendors: Benchmarking Product and Relationship Satisfaction of IT Clients, 2013

1309_ITProuctsAndRelationships_COVERWe just published a new Temkin Group data snapshot: Tech Vendors: Benchmarking Product and Relationship Satisfaction of IT Clients. This new research highlights how IT professionals rate tech vendors in two key areas of experience: Products and relationships.

During Q1, 802 IT professionals from companies with at least $500 million in annual revenues rated both the products of and their relationships with 54 tech vendors. Some of the findings include: VMware leads in six of the eight satisfaction categories—product quality, product flexibility, technical support, account team support, cost of ownership, and innovation—while Microsoft servers and IBM SPSS score highest in product features, and Apple and Microsoft desktop software lead in ease of use. Deloitte Consulting on the other hand scores last in every satisfaction category except ease of use, which Computer Sciences Corporation IT services received bottom marks in.

Download report for $495
(includes spreadsheet with data)

As you can see below, we found a wide range of ratings across the 54 tech vendors for each of the eight criteria we examined:

ProductsRelationshipsAverages

Note: IT decision makers were asked to evaluate each of the criteria on a scale from very poor (1) to excellent (7). Net satisfaction equals the percentage of 6s and 7s minus the percentage of 1s, 2s, and 3s.

The data snapshot includes eight graphics that show the scores for each of the 54 tech vendors for each of these criteria. Here are the average net scores across all of the criteria:

ProductsRelationshipsCompanies

Download report for $495
(includes spreadsheet with data)

The bottom line: Tech vendors need to improve their products and relationships

USAA On Top of 2013 Temkin Customer Service Ratings

We just released the third annual Temkin Customer Service Ratings of 235 companies across 19 industries based on a study of 10,000 U.S. consumers (see full list of firms).

Download entire dataset for $295

Company Results

Here are some company highlights:

2103TCSR_TopBottomFirms2103TCSR_IndustryLeadersLaggards

  • USAA earned the top two spots for its insurance and banking businesses. Other companies at the top of the ratings are credit unionsAce HardwareCharles SchwabDollar TreeChick-fil-ASonic Drive-InHy-VeeCostcoTrader Joe’s, Advantage, Publix, and H.E.B.
  • TV service providers and Internet service providers earned nine out of bottom 10 spots in the ratings.
  • For the second straight year, Charter Communications took the bottom spot. The rest of the firms in the bottom five are Time Warner CableCox CommunicationsOptimum (i/o), and CareFirst.
  • The following companies earned ratings that were 15 or more points above their industry averages: USAA (insurance and banking), Alaska Airlines, credit unions, Advantage, Kaiser Permanente, TriCare, Charles Schwab, and Bright House Networks.
  • Five companies earned ratings that were 15 or more points below their industry averages: Apple Stores, US AirwaysRadioShack, HSBC, and 21st Century.
  • Twenty-three percent of companies earned “strong” or “very strong” ratings, while 37% earned “weak” or “very weak” ratings.

Temkin Group also examined year-over-year results for the 171 companies that were in both the 2012 and 2013 Temkin Customer Service Ratings and found that:

  • Forty-four percent of companies improved their ratings while 47% experienced a decline.
  • Twenty companies showed double-digit increases, led by: Citibank (banking and credit cards), U.S. Bank, Hyundai, Nissan, Old Navy, Charles Schwab, Continental Airlines, and Piggly-Wiggly.
  • Eleven companies showed double-digit decreases, led by: LG, Giant Eagle, Toshiba, Cox Communications, ING Direct, and Budget.

Industry Results

Here are some industry highlights:

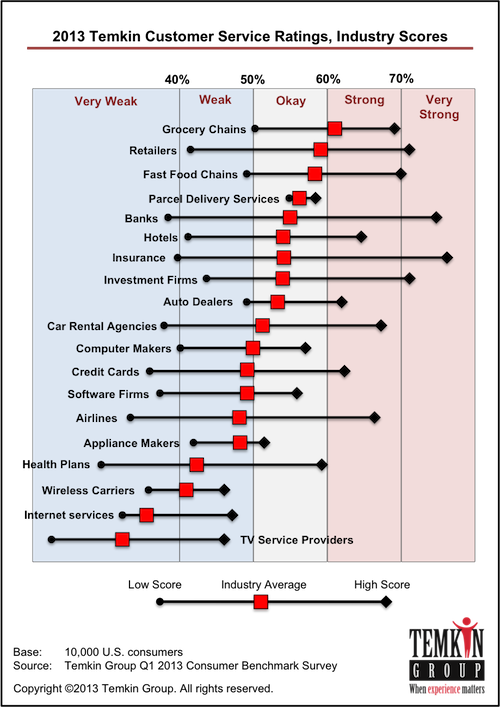
2103TCSR_Industries

  • Grocery chains, retailers, and fast food chains earned the highest average Temkin Customer Service Ratings, while TV service providers, Internet service providers, wireless carriers, and health plans earned the lowest ratings.
  • On average, credit card issuers, banks and fast food restaurants improved the most while appliance makers, TV service providers and investment firms declined the most.

Calculating the Temkin Customer Service Ratings

During January 2013, Temkin Group asked 10,000 U.S. consumers to identify the companies that they had interacted with on their websites during the previous 60 days. These consumers were asked the following question:

Thinking back to your most recent customer service interaction with these companies,
how satisfied were you with the experience?

Responses from 1= “very dissatisfied” to 7= “very satisfied”

For all companies with 100 or more consumer responses, we calculated the “net satisfaction” score. The Temkin Customer Service  Ratings are calculated by taking the percentage of consumers that selected either “6” or “7” and subtracting the percentage of consumers that selected either “1,” “2,” or “3.”

Download entire dataset for $295

Temkin Ratings website

To see all of the companies in the Temkin Customer Service Ratings as ell as all of our other Temkin Ratings and sort through the results, visit the Temkin Ratings website

The bottom line: TV service providers deliver terrible customer service