We just published a Temkin Group report, Tech Vendor NPS Benchmark, 2014, The research examines Net Promoter Scores and the link to loyalty for 63 tech vendors based on feedback from IT decision makers. We also compared overall results to our 2013 NPS benchmark and our 2012 NPS benchmark. Here’s the executive summary:
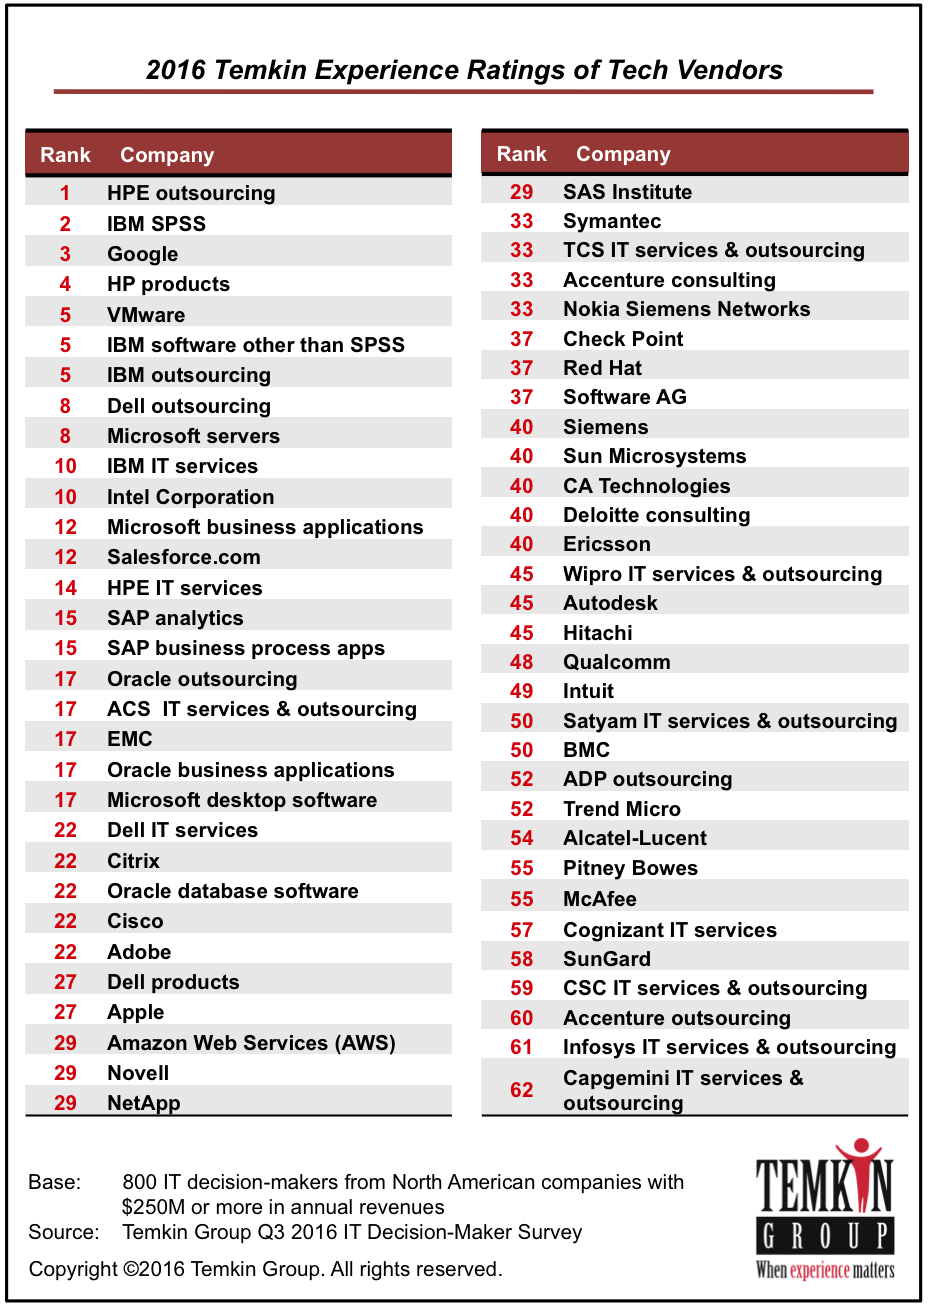
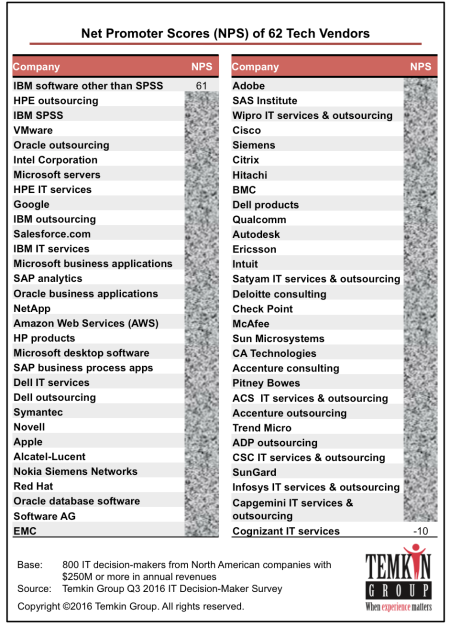
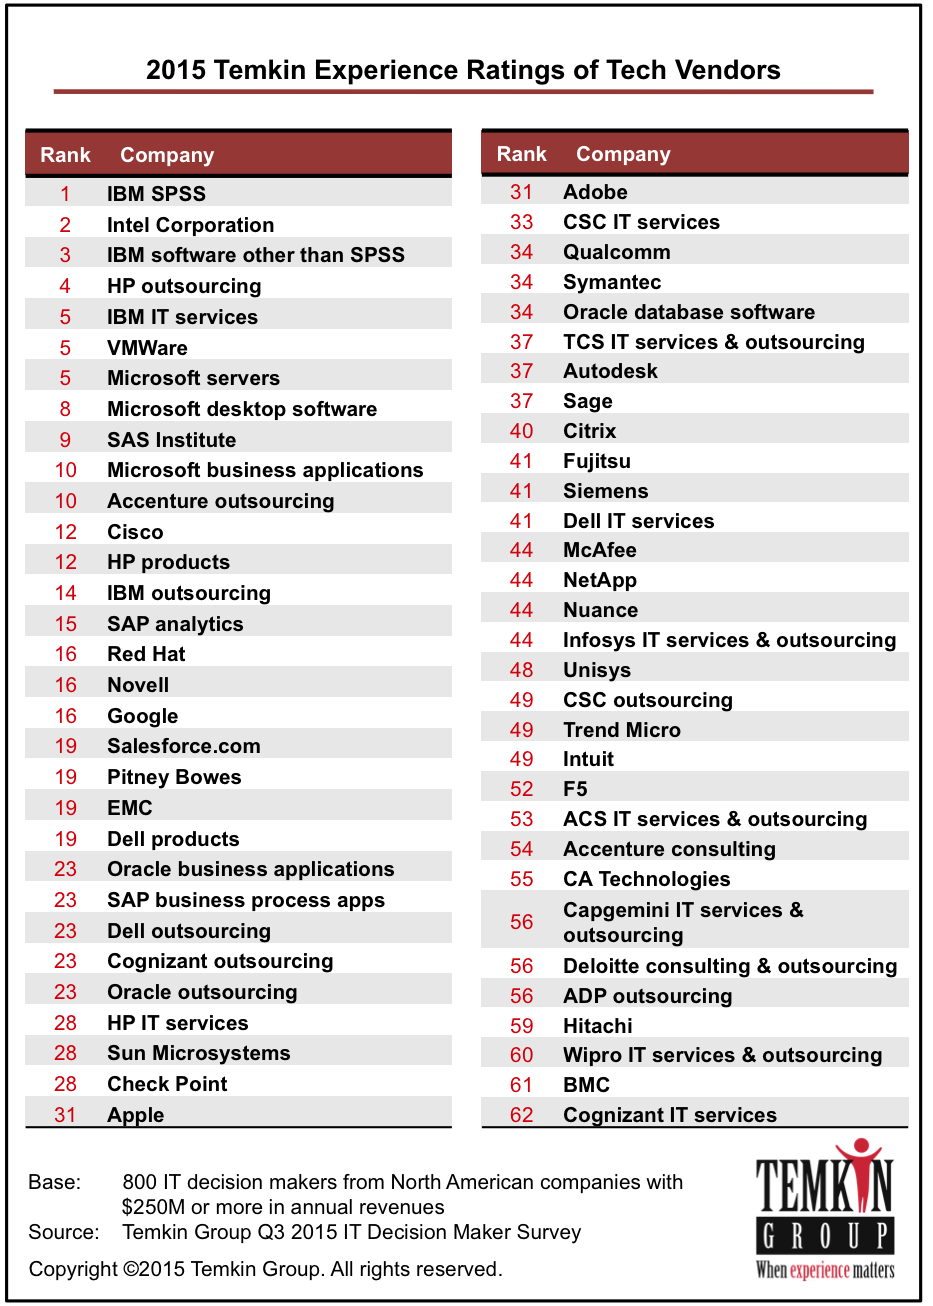
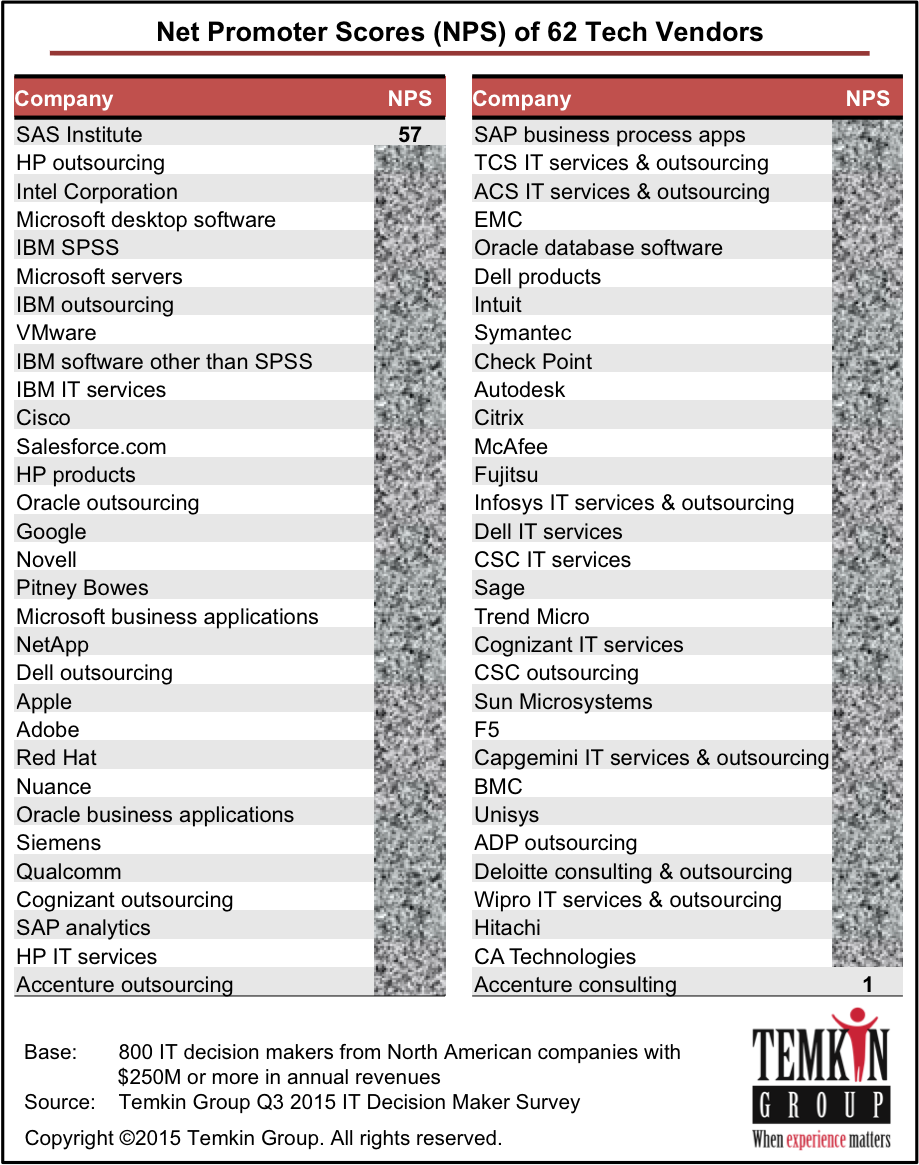
We surveyed IT decision-makers from more than 800 large North American firms to learn about their relationships with their tech vendors. We asked them a series of questions regarding their experiences as the clients of different tech vendors, and one of the questions we posed generated Net Promoter Scores® (NPS®) for the companies. Of the 63 companies we looked at, EDS and VMware earned the highest NPS, while Autodesk and Cognizant received the lowest. The overall industry average NPS dropped for the second year in a row. Our analysis also delved into the correlation between NPS and loyalty, revealing that, compared to severe detractors, promoters are much more likely to spend more money with their tech vendors in 2014, try new products and services when they are announced, and forgive the vendor for a mistake. We compared the loyalty levels for each vendor, and we found that SunGard and IBM software have the most customers planning on increasing their purchases in 2014, while Satyam and EDS customers are the most willing to try new offerings, and Satyam has the most forgiving customers. Our research also shows that promoters are more concerned than detractors about getting lower prices.
Download report for $695 (includes Excel spreadsheet with data)

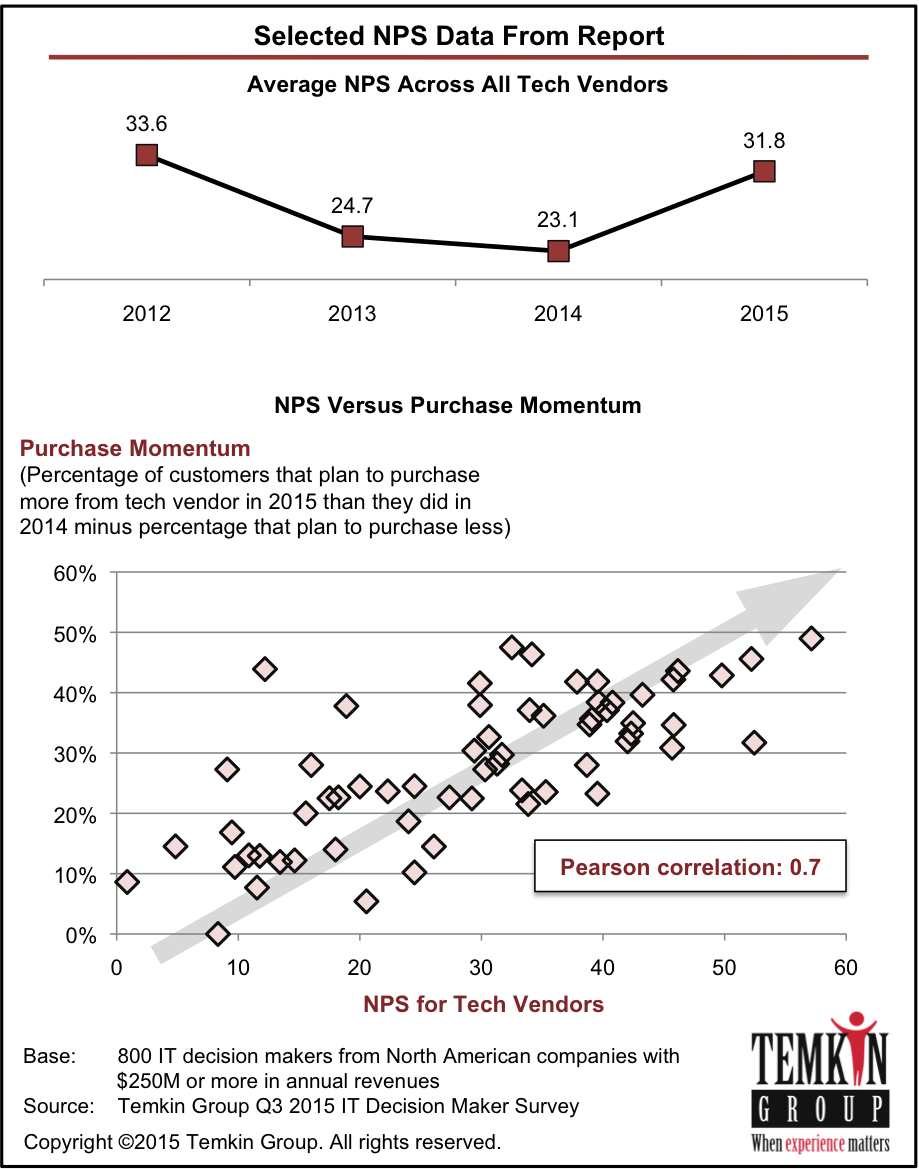
This is the third year that Temkin Group has completed the NPS study. Over that time, the average NPS in the tech industry has been dropping. NPS in for tech vendors was 33.6 in 2012 and 24.7 in 2013, falling to 23.1 in 2014.
With an NPS of 48, EDS came out with the top score followed closely by VMware with 45. Six other tech vendors received NPS of 35 or more: EMC, Microsoft servers, Oracle outsourcing, Pitney Bowes, Microsoft business applications, and Cisco.
At the other end of the spectrum, three tech vendors have negative NPS: Autodesk, Cognizant, and Wipro. Six other vendors fell below 10: Capgemini, Intuit, ADP outsourcing, CA, Infosys, and HP outsourcing.

The report also examines the link between NPS and loyalty. Our analysis shows that promoters are more than six times likely to forgive a tech vendor if they deliver a bad experience, about seven times as likely to try a new offering from the company, and almost three times as likely to purchase more from them in 2014 than they did in 2013.
In addition to benchmarking NPS, the research measures the loyalty that large companies have for their tech vendors. Respondents have the most plans to increase spending with SunGard, IBM software, Alcatel-Lucent, and ACS. They are most likely to try new offerings from Satyam, EDS, and EMC. And if the tech vendors make a mistake, IT decision makers are most likely to forgive Satyam, EDS, Ericsson, and Alcatel-Lucent. NPS characterizes respondents as Promoters when they are very likely to recommend and Detractors when they are very unlikely to recommend.
Report details: The report includes graphics with data for NPS, 2014 purchase intentions, likelihood to forgive, likelihood to try a new offering, and areas of improvement for the 63 tech vendors that had at least 40 pieces of feedback. The excel spreadsheet includes this data (in more detail) for the 63 companies as well as for 22 other tech vendors with less than 40 pieces of feedback. It also includes the summary NPS scores from 2013. If you want to know more about the data file, download this excel spreadsheet without the data.
Download report for $695 (includes Excel spreadsheet with data)
The bottom line: When it comes to NPS, large tech vendors are heading in the wrong direction
Note: See our 2013 NPS benchmark and 2012 NPS benchmark for tech vendors as well as our page full of NPS resources.
P.S. Net Promoter Score, Net Promoter, and NPS are registered trademarks of Bain & Company, Satmetrix Systems, and Fred Reichheld.
 We just published a Temkin Group data snapshot, Tech Vendors: Product and Relationship Satisfaction of IT Clients, 2017.
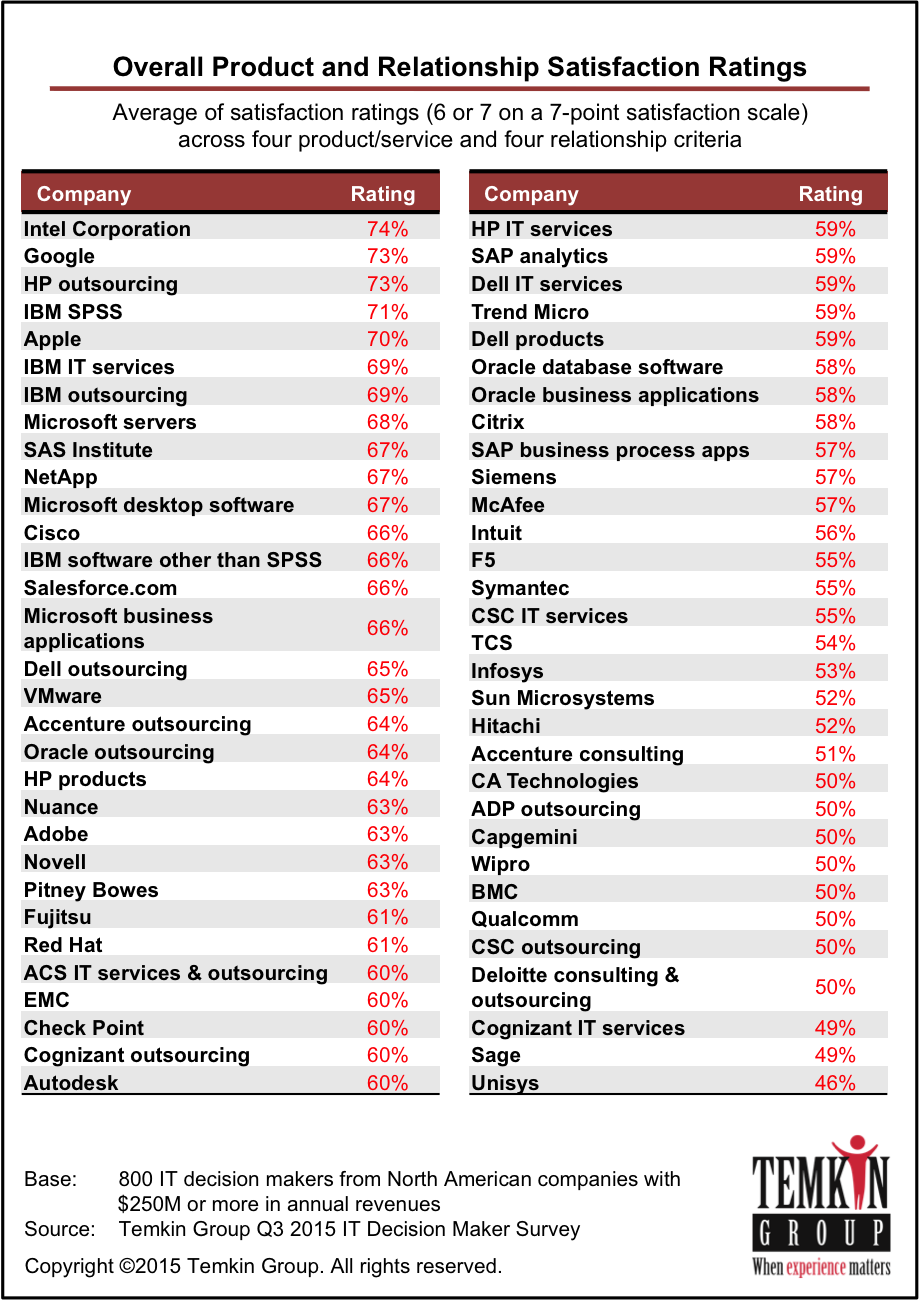
 Temkin Group created the Client Success Ratings (CSR), which is the percentage of respondents who answered 6 or 7. As you can see below, the average CSR is 63%, which is an increase from 61% last year.