Report: Tech Vendors: Product and Relationship Satisfaction, 2017

1701_ds_techproductsandrelationships_coverWe just published a Temkin Group data snapshot, Tech Vendors: Product and Relationship Satisfaction of IT Clients, 2017.

During Q3 of 2016, we surveyed 800 IT decision-makers from companies with at least $250 million in annual revenues, asking them to rate both the products of and their relationships with 62 different tech vendors. HPE outsourcing, Google, and IBM SPSS earned the top overall scores, while Trend Micro, Infosys, and SunGard received the lowest overall scores. To determine their product rating, we evaluated tech vendors across four product/service criteria: features, quality, flexibility, and ease of use. And we calculated their relationship rating using four different criteria: technical support, support of the account team, cost of ownership, and innovation of company. We also looked at how the average product and relationship scores of tech vendors have changed over the previous three years.

This research has a report (.pdf) and a dataset (excel). The dataset has the details of Product/Service and Relationship satisfaction for the 62 tech vendors as well as for several tech vendors with sample sizes too small to be included in the published report.

Download report for $495
(includes Excel spreadsheet with data)
BuyDownload3

Here’s a link to last year’s study.

The research examines eight areas of satisfaction; four that deal with products & services and four that examine relationships. Tech vendors earned the highest average satisfaction level for product features (64%) and the lowest for total cost of ownership (57%).

As you can see in the chart below, the overall product/service & relationship satisfaction ranges from a high of 76% for HPE outsourcing down to a low of 42% for Trend Micro.

1701_techproductrelationshipoverallresults

Read more of this post

Report: Tech Vendor NPS Benchmark, 2016 (B2B)

1609_technpsbenchmark_coverWe just published a Temkin Group report, Tech Vendor NPS Benchmark, 2016, The research examines Net Promoter Scores and the link to loyalty for 62 tech vendors based on feedback from 800 IT decision makers in large North American organizations. We also compared overall results to our benchmarks from the previous four years. Here’s the executive summary:

For the fifth year in a row, we examined the link between Net Promoter Scores® (NPS®) and loyalty for technology vendors. We surveyed 800 IT decision-makers from large North American firms to learn about their relationships with their technology providers. Of the 62 tech vendors we evaluated, IBM, HPE outsourcing, IBM SPSS, and VMware earned the highest NPS, while Cognizant, Capgemini, and Infosys received the lowest. Overall, the average NPS for the tech vendor industry decreased by almost 2 percentage points from last year. Our analysis shows that promoters are much more likely than detractors to increase their spending with tech vendors, try new products and services when they are announced, and forgive tech vendors after a bad experience. We also found that Software AG and HPE outsourcing are the top companies for purchase momentum, while IBM SPSS, IBM software, and IBM outsourcing have the highest Temkin Innovation Equity Quotient, and HPE outsourcing and IBM SPSS are at the top of the Temkin Forgiveness Ratings.

The report includes graphics with data for NPS, purchase intentions, likelihood to forgive, and likelihood to try a new offering. The excel spreadsheet includes this data (in more detail) for the 62 companies as well as for other tech vendors with less than 40 pieces of feedback. It also includes the summary NPS scores from 2015.

Download report for $695
(includes Excel spreadsheet with data)
BuyDownload3

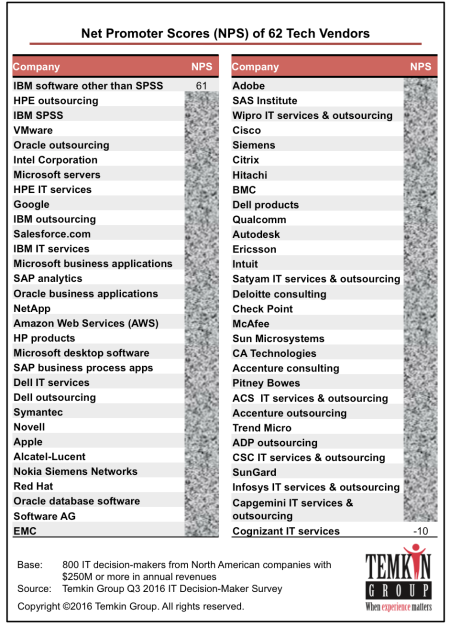
As you can see in the chart below, the NPS ranges from a high of 61 for IBM software down to  a low of -10 for Cognizant IT services.

1609_techvendornpsclear

The industry average NPS decreased to 29.9 this year. The research also includes data for Purchase Momentum (how much customers are planning to buy), Temkin Forgiveness Ratings (likelihood of customers to forgive after a bad experience), and Temkin Innovation Equity Quotient (likelihood of customer to try a new offering). We not only list the results for each company, but we also show that NPS is highly correlated to each of these items (as you can see below for Purchase Momentum).

1609_techvendornpstrendandcorrelatoin

Report details: When you purchase this research, you will receive a written report and an excel spreadsheet with more data. The report includes graphics with data for NPS, purchase momentum, Temkin Forgiveness Ratings, and Temkin Innovation Equity Quotient for the 62 tech vendors that had at least 40 pieces of feedback. The excel spreadsheet includes this data (in more detail) for the 62 companies as well as for other tech vendors with less than 40 pieces of feedback. It also includes the summary NPS scores from 2015. If you want to know more about the data file, download this SAMPLE SPREADSHEET without the data (.xls).

Download report for $695
(includes Excel spreadsheet with data)
BuyDownload3

Note: See our 2015 NPS benchmark2014 NPS benchmark2013 NPS benchmark and 2012 NPS benchmark for tech vendors as well as our page full of NPS resources.

P.S. Net Promoter Score, Net Promoter, and NPS are registered trademarks of Bain & Company, Satmetrix Systems, and Fred Reichheld.

Report: Tech Vendors: Product and Relationship Satisfaction, 2016

1601_DS_TechProductsAndRelationships_COVERWe just published a Temkin Group data snapshot, Tech Vendors: Product and Relationship Satisfaction of IT Clients, 2016.

During Q3, 2015, 800 IT professionals from companies with at least $250 million in annual revenues rated both the products of and their relationships with 62 tech vendors. The research examines satisfaction with eight areas: product/service features, product/service quality, product/service flexibility, product/service ease of use, technical support, support of the account team, cost of ownership, and innovation of company. Some of the findings include that Intel, Google, and HP outsourcing earned the highest overall satisfaction ratings, while Unisys, Sage, and Cognizant IT services earned the lowest. When it comes to product satisfaction, Intel leads in product features, Apple and IBM IT services lead in product quality, Google leads in product flexibility, and NetApp leads in product ease of use. When it comes to relationship satisfaction, HP outsourcing leads in tech support and in cost of ownership, Intel leads in account team support, and Google leads in innovation.

This product has a report (.pdf) and a dataset (excel). The dataset has the details of Product/Service and Relationship satisfaction for the 62 tech vendors as well as for several tech vendors with sample sizes too small to be included in the published report.

Download report for $495
(includes Excel spreadsheet with data)
BuyDownload3

As you can see in the chart below, the overall product/service & relationship satisfaction ranges from a high of 74% for Intel down to a low of 46% for Unisys.

1601_ProductRelationshipSatisfaction_Ratings

The chart below shows the average scores across all satisfaction criteria. Tech vendors scored the highest in innovation (64%) and the lowest in cost of ownership (56%).1601_ProductRelationshipSatisfaction_Elements

Report details: When you purchase this research, you will receive a written data snapshot and an excel spreadsheet with more data.The dataset has the details of Product/Service and Relationship satisfaction for the 62 tech vendors as well as for several tech vendors with sample sizes too small to be included in the published report. If you want to know more about the data file, download this SAMPLE SPREADSHEET without the data (.xls).

Download report for $495
(includes Excel spreadsheet with data)
BuyDownload3

Report: Tech Vendor NPS Benchmark, 2015 (B2B)

1509_IT_NPSBenchmark_COVERWe just published a Temkin Group report, Tech Vendor NPS Benchmark, 2015, The research examines Net Promoter Scores and the link to loyalty for 62 tech vendors based on feedback from IT decision makers in large North American organizations. We also compared overall results to our benchmarks from the previous three years. Here’s the executive summary:

To examine the link between Net Promoter Scores® (NPS®) and loyalty, we surveyed 800 IT decision-makers from large North American firms to learn about their relationships with their technology providers. Of the 62 tech vendors we evaluated, SAS Institute, HP outsourcing, and Intel earned the highest NPS, while Accenture, CA Technologies, and Hitachi received the lowest. Overall, the tech vendor industry’s average NPS jumped to 31.8 in 2015—an increase of more than eight points—after two straight years of declining scores. Our analysis shows that promoters are much more likely than detractors to spend more money with tech vendors, try new products and services when they are announced, and forgive their tech vendors after a bad experience. Our results also revealed that SAS Institute and Cognizant outsourcing were the top companies for purchase momentum, IBM SPSS and Intel have the highest Temkin Innovation Equity Quotient, and HP outsourcing and Intel scored the highest in the Temkin Forgiveness Ratings.

The report includes graphics with data for NPS, purchase intentions, likelihood to forgive, and likelihood to try a new offering. The excel spreadsheet includes this data (in more detail) for the 62 companies as well as for 25 other tech vendors with less than 40 pieces of feedback. It also includes the summary NPS scores from 2014.

Download report for $695
(includes Excel spreadsheet with data)
BuyDownload3

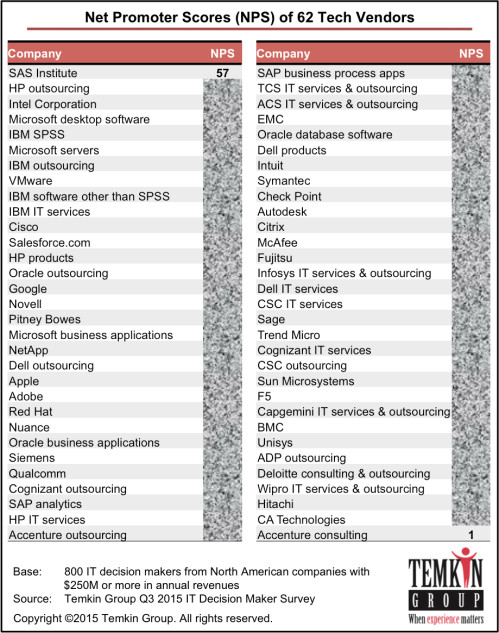
As you can see in the chart below, the NPS ranges from a high of 57 for SAS Institute down to  a low of 1 for Accenture consulting.

1509_TechNPS_Listing

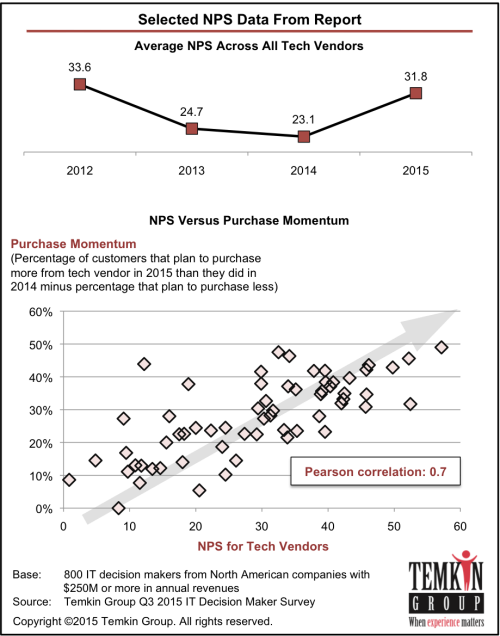
After declining for the past two years, the industry average NPS increased to 31.8 this year, almost reaching the level from our initial study in 2012. The research also includes data for Purchase Momentum (how much customers are planning to buy), Temkin Forgiveness Ratings (likelihood of customers to forgive after a bad experience), and Temkin Innovation Equity Quotient (likelihood of customer to try a new offering). We not only list the results for each company, but we also show that NPS is highly correlated to each of these items (as you can see below for Purchase Momentum).

1509_TechNPS_TrendPurchase

Report details: When you purchase this research, you will receive a written report and an excel spreadsheet with more data. The report includes graphics with data for NPS, purchase momentum, Temkin Forgiveness Ratings, and Temkin Innovation Equity Quotient for the 62 tech vendors that had at least 40 pieces of feedback. The excel spreadsheet includes this data (in more detail) for the 62 companies as well as for 25 other tech vendors with less than 40 pieces of feedback. It also includes the summary NPS scores from 2014. If you want to know more about the data file, download this SAMPLE SPREADSHEET without the data (.xls).

Download report for $695
(includes Excel spreadsheet with data)
BuyDownload3

Note: See our 2014 NPS benchmark2013 NPS benchmark and 2012 NPS benchmark for tech vendors as well as our page full of NPS resources.

P.S. Net Promoter Score, Net Promoter, and NPS are registered trademarks of Bain & Company, Satmetrix Systems, and Fred Reichheld.

Formation of MaritzCX is Sign of VoC Times

In case you missed it, the VoC technology provider Allegiance was purchased by Maritz Holdings and then combined with Maritz Research (a part of the acquiring company) to form MaritzCX. Carine Clark, the CEO of Allegiance, was named CEO of the new company.

My take: First of all, I like the move for both Martiz and Allegiance. MaritzCX can offer a strong technology platform and a strong services capability. The newly formed company has the scale and capabilities to compete effectively for most large-scale VoC implementations.

Allegiance has been one of the growing class of applications that I call Customer Insight and Action (CIA) Platforms. I coined this term in 2010 while other people were calling them Enterprise Feedback Management (EFM) systems. As the dynamics in the market continue to play out, these technologies are looking even more like CIA Platforms. Rather than just focusing on surveys and other forms of feedback, these systems increasingly:

  • Incorporate non-feedback data like customer profiles and transactional history
  • Distribute tailored, contextual insights across an organization
  • Provide alerts based on specific criteria
  • Support workflow associated with taking action based on the insights
  • Integrate with other applications like CRM and workforce management

The acquisition/merger is an acknowledgement that running a leading-edge VoC program requires more than a technology platform. Recent Temkin Group shows that only 11% of VoC programs within large companies have reached the top levels of maturity. These efforts aren’t easy. This graphic from our report, Text Analytics Reshapes VoCs, highlights some of the capabilities that future VoC programs will need: TAVoCChanges

To implement a world-class VoC program, companies need to undergo significant change. It takes a combination of:

  • CIA Platform for gathering customer data, uncovering insights, and sharing actionable insights across the organization.
  • Skills for defining research methodologies, managing the data flow, analyzing data, and building processes for sharing actionable insights and driving continuous improvement.
  • Governance for ensuring that the company makes changes across the company based on the flow of actionable insights.

MaritzCX is an attempt to combine those capabilities into a single provider. That’s the same motivation that led Mindshare (renamed InMoment) to acquire Empathica last year (which was a move that I liked for those companies as well).

This acquisition will push other aspiring CIA Platform vendors such as Clarabridge, Confirmit, Kampyle, Medallia, NICE, Qualtrics, ResponseTek, and Verint to strengthen their relationships with services companies.

Will there be more acquisition in the VoC arena? Absolutely. CIA Platforms are a natural extension to CRM and analytics applications, so watch for the big software players (e.g., Oracle, Salesforce.com, IBM, SAP) to get more active into this space.

The bottom line: MaritzCX is a sign of things to come.


Report: Tech Vendor NPS Benchmark, 2014

1407_IT_NPSBenchmark_COVERWe just published a Temkin Group report, Tech Vendor NPS Benchmark, 2014, The research examines Net Promoter Scores and the link to loyalty for 63 tech vendors based on feedback from IT decision makers. We also compared overall results to our 2013 NPS benchmark and our 2012 NPS benchmark. Here’s the executive summary:

We surveyed IT decision-makers from more than 800 large North American firms to learn about their relationships with their tech vendors. We asked them a series of questions regarding their experiences as the clients of different tech vendors, and one of the questions we posed generated Net Promoter Scores® (NPS®) for the companies. Of the 63 companies we looked at, EDS and VMware earned the highest NPS, while Autodesk and Cognizant received the lowest. The overall industry average NPS dropped for the second year in a row. Our analysis also delved into the correlation between NPS and loyalty, revealing that, compared to severe detractors, promoters are much more likely to spend more money with their tech vendors in 2014, try new products and services when they are announced, and forgive the vendor for a mistake. We compared the loyalty levels for each vendor, and we found that SunGard and IBM software have the most customers planning on increasing their purchases in 2014, while Satyam and EDS customers are the most willing to try new offerings, and Satyam has the most forgiving customers. Our research also shows that promoters are more concerned than detractors about getting lower prices.

Download report for $695 (includes Excel spreadsheet with data)
BuyDownload3

This is the third year that Temkin Group has completed the NPS study. Over that time, the average NPS in the tech industry has been dropping. NPS in for tech vendors was 33.6 in 2012 and 24.7 in 2013, falling to 23.1 in 2014.

With an NPS of 48, EDS came out with the top score followed closely by VMware with 45. Six other tech vendors received NPS of 35 or more: EMC, Microsoft servers, Oracle outsourcing, Pitney Bowes, Microsoft business applications, and Cisco.

At the other end of the spectrum, three tech vendors have negative NPS: Autodesk, Cognizant, and Wipro. Six other vendors fell below 10: Capgemini, Intuit, ADP outsourcing, CA, Infosys, and HP outsourcing.

1407_ITNPS_Companies

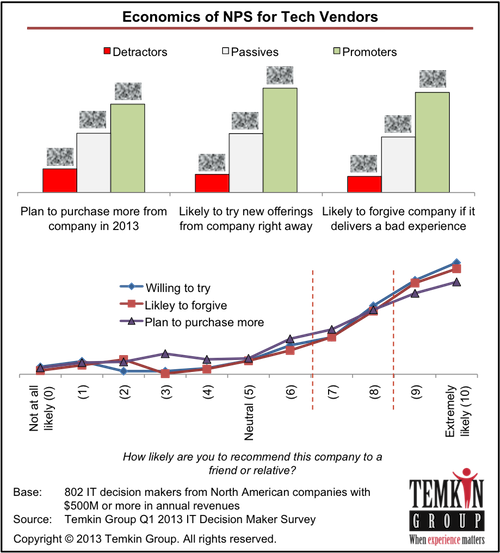
The report also examines the link between NPS and loyalty. Our analysis shows that promoters are more than six times likely to forgive a tech vendor if they deliver a bad experience, about seven times as likely to try a new offering from the company, and almost three times as likely to purchase more from them in 2014 than they did in 2013.

In addition to benchmarking NPS, the research measures the loyalty that large companies have for their tech vendors. Respondents have the most plans to increase spending with SunGard, IBM software, Alcatel-Lucent, and ACS. They are most likely to try new offerings from Satyam, EDS, and EMC. And if the tech vendors make a mistake, IT decision makers are most likely to forgive Satyam, EDS, Ericsson, and Alcatel-Lucent. NPS characterizes respondents as Promoters when they are very likely to recommend and Detractors when they are very unlikely to recommend.

Report details: The report includes graphics with data for NPS, 2014 purchase intentions, likelihood to forgive, likelihood to try a new offering, and areas of improvement for the 63 tech vendors that had at least 40 pieces of feedback. The excel spreadsheet includes this data (in more detail) for the 63 companies as well as for 22 other tech vendors with less than 40 pieces of feedback. It also includes the summary NPS scores from 2013. If you want to know more about the data file, download this excel spreadsheet without the data.

Download report for $695 (includes Excel spreadsheet with data)
BuyDownload3

The bottom line: When it comes to NPS, large tech vendors are heading in the wrong direction

Note: See our 2013 NPS benchmark and 2012 NPS benchmark for tech vendors as well as our page full of NPS resources.

P.S. Net Promoter Score, Net Promoter, and NPS are registered trademarks of Bain & Company, Satmetrix Systems, and Fred Reichheld.

Tech Vendors: Benchmarking Product and Relationship Satisfaction of IT Clients, 2013

1309_ITProuctsAndRelationships_COVERWe just published a new Temkin Group data snapshot: Tech Vendors: Benchmarking Product and Relationship Satisfaction of IT Clients. This new research highlights how IT professionals rate tech vendors in two key areas of experience: Products and relationships.

During Q1, 802 IT professionals from companies with at least $500 million in annual revenues rated both the products of and their relationships with 54 tech vendors. Some of the findings include: VMware leads in six of the eight satisfaction categories—product quality, product flexibility, technical support, account team support, cost of ownership, and innovation—while Microsoft servers and IBM SPSS score highest in product features, and Apple and Microsoft desktop software lead in ease of use. Deloitte Consulting on the other hand scores last in every satisfaction category except ease of use, which Computer Sciences Corporation IT services received bottom marks in.

Download report for $495
(includes spreadsheet with data)

As you can see below, we found a wide range of ratings across the 54 tech vendors for each of the eight criteria we examined:

ProductsRelationshipsAverages

Note: IT decision makers were asked to evaluate each of the criteria on a scale from very poor (1) to excellent (7). Net satisfaction equals the percentage of 6s and 7s minus the percentage of 1s, 2s, and 3s.

The data snapshot includes eight graphics that show the scores for each of the 54 tech vendors for each of these criteria. Here are the average net scores across all of the criteria:

ProductsRelationshipsCompanies

Download report for $495
(includes spreadsheet with data)

The bottom line: Tech vendors need to improve their products and relationships

Report: Tech Vendor NPS Benchmark, 2013

1306_IT_NPSBenchmark_COVERWe just published a Temkin Group report, Tech Vendor NPS Benchmark, 2013, The research examines Net Promoter Scores and the link to loyalty for 54 tech vendors based on feedback from IT decision makers. We also compared results to the NPS data we published last year. Here’s the executive summary:

We surveyed IT decision makers from more than 800 large North American firms to understand how they view their tech vendors. One of the questions we asked provides Net Promoter Scores® (NPS®) for 54 of those companies. VMWare and SAP analytics earned the highest NPS while CSC IT services and Infosys IT services earned the lowest. The overall industry average NPS dropped nine points from last year. Our analysis also examined the link between NPS and loyalty, finding that compared with detractors, promoters are more than six times as likely to forgive a tech vendor if they deliver a bad experience, almost six times as likely to try a new offering from the vendor, and more than three times as likely to purchase more from them this year. When examining the loyalty levels for each vendor, we found that Oracle consulting and VMWare clients have the strongest purchase intentions, SAP analytics and Sybase have earned the most forgiveness, and VMWare and SAP analytics have the most innovation equity.

Download report for $495 (includes Excel spreadsheet with data)
BuyDownload3

Here are some of the findings from the research:

  • With an NPS of 47, VMware came out on top followed closely by SAP analytics with 45. At the other end of the spectrum, four tech vendors have negative NPS: CSC IT services, Infosys IT services, Alcatel-Lucent, and Deloitte consulting.
  • The average NPS in the tech industry went from 33.6 in 2012 to 24.7 in 2013. The percentage of promoters dropped seven points.
  • Compared with detractors, we found that promoters are more than six times likely to forgive a tech vendor if they deliver a bad experience, almost six times as likely to try a new offering from the company, and more than three times as likely to purchase more from them in 2013.
  • Forgiveness and willingness to try increase steadily starting at 3 while increased purchases begins steady growth at 5.
  • Promoters most frequently wanted lower prices and better support, while passives and detractors were looking for better support.
  • Oracle outsourcing has the strongest purchase intentions while Trend Micro has the weakest.
  • SAP analytics and Sybase have earned the most forgiveness while Trend Micro has earned the least.
  • VMware has the most innovation equity while Accenture consulting and Intuit have the least.

1306_ITNPS2

1305_ITNPS_Economics

Download report for $495 (includes Excel spreadsheet with data)
BuyDownload3

The bottom line: When it comes to NPS, large tech vendors are heading in the wrong directions

Note: See our 2012 NPS ratings for tech vendors and the post 9 Recommendations For Net Promoter Score along with all of my other posts about NPS.

P.S. Net Promoter Score, Net Promoter, and NPS are registered trademarks of Bain & Company, Satmetrix Systems, and Fred Reichheld.

Cloud Computing Leaders: Google, Microsoft, and ACS

The “cloud” is a popular topic in IT circles. So we decided to examine how much it will affect companies and how prepared technology vendors are to satisfy those changing customer demands. During January 2012, we asked 800 IT professionals from companies with at least $500 million in annual revenues two questions about cloud computing:

  • Cloud importance: To what degree will the shift to cloud computing influence your company’s IT strategy over the next three years? (Note: 79% of IT professionals say it will have a significant influence)
  • Cloud capabilities: Given your company’s plans for cloud computing, how would you rate the cloud computing capabilities of the IT vendors that you interact with compared with where they need to be?

To fully understand how prepared tech vendors are to meet their client’s changing IT needs for cloud computing, Temkin Group created the Cloud Readiness Index (CRI), a measure of where vendors are in their cloud capabilities compared with the needs of their customers. The CRI takes the cloud importance results and divides it by the cloud capability results as follows:

Here is the Cloud Readiness Index data for 60 tech vendors. Google, Microsoft’s business applications, and ACS are on top of 15 tech vendors in the “leading” category. At the other end of the spectrum, Autodesk, Check Point, and CGI are on the bottom of 25 tech vendors in the “lagging” category.
You can download the data from this post in an Excel spreadsheet for $195. The file includes detailed data for the Cloud Readiness Index as well as details for Cloud Importance and Cloud Capabilities. The spreadsheet includes the data for the 60 tech vendors listed in this post as well as for 28 other tech vendors with smaller sample sizes.

 The bottom line: Tech vendors need to meet their client’s cloud needs

Net Promoter Score and Market Share For 60 Tech Vendors

Temkin Group recently surveyed 800 IT professionals from large companies and asked them a series of questions about tech vendors. This research has fueled some of our previous posts: Temkin Experience Ratings for Tech Vendors, How IT Professionals Share Feedback About Vendors, and Tech Vendors: Benchmarking Product and Relationship Satisfaction of IT Clients.

We also asked the IT professionals to rate each tech vendor on the Net Promoter Score (NPS) scale.* NPS is based on one question: How likely are you to recommend the tech vendor to a friend or colleague? IT professionals choose an answer on a scale from 0 (not at all likely) to 10 (extremely likely). Responses are put into one of three categories:

  • Promoters (score 9 or 10)
  • Passives (score 7 or 8)
  • Detractors (score 0 to 6)

NPS is calculated as the percentage of promoters minus the percentage of detractors. (If you’re interested in best practices for using NPS, read my post 9 Recommendations for NPS which is also part of our VoC resource page).

Here is the NPS for 60 tech vendors, ranging from Intel, Microsoft and Cisco in the 50s down to Compuware, Unisys, Cognizant, and Capgemini below 10.

We also asked the IT professionals how much their company was planning to spend in 2012 compared with 2011 and mapped this data with NPS. It turns out that we found four bands of performance in this market based on NPS scores:

  • More than 40: These companies have much higher purchase momentum and are poised to grab a lot of market share
  • Between 28 and 40: These companies have above average purchase momentum and are poised to gain market share
  • Between 23 and 28: These companies have below average purchase momentum and are poised to lose market share
  • Less than 23: These companies have much lower purchase momentum and are poised to give up a lot of market share

You can purchase the data in an excel spreadsheet for $195. The file includes details on the 60 tech vendors shown in this blog post as well as 28 other tech vendors with sample sizes too small to be included in our published research. The data includes sample sizes for the companies, percentages for promoters, detractors, and NPS score, as well as the percentage of companies with increasing spending plans and those with decreasing spending plans.

*Note: Net Promoter, NPS, and Net Promoter Score are trademarks of Satmetrix Systems, Bain & Company, and Fred Reichheld

Tech Vendors: Benchmarking Product and Relationship Satisfaction of IT Clients

We just published a new Temkin Group data snapshot: Tech Vendors: Benchmarking Product and Relationship Satisfaction of IT Clients. This new research highlights how IT professionals rate tech vendors in two key areas of experience: Products and relationships.

During January 2012, 800 IT professionals from companies with at least $500 million in annual revenues rated the products of and their relationships with 60 tech vendors. Some of the findings include: Intel dominates in product flexibility, Cisco leads in product features, Compuware’s product features are severely lacking, Google has a big lead in cost of ownership, Intel dominates in product flexibility, Apple leads in innovation, and Wipro is far behind in technical support.

Download report for $295

As you can see below, we found a wide range of ratings across the 60 tech vendors for each of the eight criteria we examined:

The data snapshot includes eight graphics that show the scores for each of the 60 tech vendors for each of these criteria. Here’s a summary of the firms with the highest and lowest average ratings:

Download report for $295
(includes spreadsheet with data)

The bottom line: Tech vendors need to improve their product and relationship experiences

Report: 2012 Temkin Experience Ratings of Tech Vendors

We are excited to be publishing this first report from our large-scale research on customer experience in the IT sector.

We just published a new Temkin Group report, 2012 Temkin Experience Ratings of Tech Vendors. The report analyzes feedback from 800 IT professionals to rate 60 tech suppliers. Congratulations to the top firms:

1) Microsoft (business applications)
1) Cisco
3) IBM SPSS
3) Microsoft (servers)
5) Microsoft (desktop software)
5) IBM software (other than SPSS)
5) Intel

Here is the executive summary from the report:

To understand the customer experience delivered by IT vendors, we surveyed 800 IT professionals from large companies. Using their feedback on the functional, accessible, and emotional components of experiences with vendors, we created the 2012 Temkin Experience Ratings for Tech Vendors which rates 60 large IT suppliers by their customers. Microsoft business applications, Cisco, IBM SPSS, and Microsoft servers were at the top of the list with “excellent” ratings. At the other end of the spectrum, Compuware, Capgemini, and Fujitsu were at the bottom of nine companies with “very poor” ratings. Our research also looked at the 2012 purchase plans for these IT buyers. When we chart the Temkin Experience Ratings for Tech Vendors with the purchase momentum for these 60 firms, it shows the clear connection between customer experience and revenues.

Download report for $295

The Temkin Experience Ratings for Tech Vendors are based on evaluating three elements of experience:

  1. Functional: How well do experiences meet customers’ needs?
  2. Accessible: How easy is it for customers to do what they want to do?
  3. Emotional: How do customers feel about the experiences?

Here are the ratings for all 60 tech vendors that had feedback from at least 60 IT professionals:

The report also examined IT purchasing plans. We created a purchasing momentum index, equal to the percentage of companies planning to increase spending in 2012 minus the percentage that were planning to decrease spending. The report contains the purchasing momentum for all 60 tech vendors in the study. It turns out that the Temkin Experience Ratings are highly connected with purchase momentum:

Download report for $295

The bottom line: Customer experience and loyalty go hand in hand in the tech sector.

Verint Buys Vovici; Let The Games Begin

I spoke with Verint and Vovici execs today about Verint’s acquisition of Vovici for an estimated $76 million. For those of you who don’t know these vendors, Verint provides workforce management, call recording, and analytical capabilities targeted at contact centers. Vovici is an Enterprise Feedback Management (EFM) vendor (I consider EFM an outdated term) that provides voice of the customer (VoC) software and services. It appears that Vovici will continue to operate somewhat independently as “A Verint Company.”

My take: First of all, kudos to Verint. It’s a good extension to its offering and the price tag seems fair (although I don’t get too involved in valuations). And, they can share all of the company towels that have a “V” monogram. 🙂 This is a natural evolution in the market, and is consistent with the M&A activity I’ve expected and have been writing about for a while. Here are some things that I think we can learn from this acquisition:

  • The contact center is a VoC goldmine. There’s a ton of insights about customers that remain locked inside of contact centers. Companies can learn a lot by blending their contact center interactions into their voice of the customer programs.
  • Unstructured data is critical. Vovici grew up as a survey vendor which is the heritage of most of the “EFM” firms. But there’s a ton of lost insight in unstructured content such as social media conversations, call center interactions, sales notes, etc. That’s why “unstructured data appreciation” is one of our 8 customer experience megatrends. Vovici will be able to tap into Verint’s voice analytics to offer compelling capabilities around things like mobile voice feedback.
  • Look for a NICE next move. Verint’s largest competitor, Israel-based Nice Systems, needs to make a move. With a ton of “EFM” vendors around, there are a lot to choose from (including Allegiance, Medallia, Mindshare, and even another Israeli firm, Ransys, to name just a few of the many vendors).
  • The big boys will awaken. Verint’s acquisition of a major player in this market will accelerate the moves by large software players such as SAP, Oracle, SAS, and IBM. I’ve discussed that this market was heading away from “EFM” vendors towards what I’ve called “Customer Insight And Action (CIA) Platforms.” These vendors are evolving into other categories like CRM, BI, analytics, contact center, and BPM in which much larger vendors play.
  • Voice of the customer programs are evolving. All of these vendor moves will make it easier for companies to develop actionable insights from a variety of data sources. That’s why firms must continue to update and evolve their VoC programs.

The bottom line: This is the start of a busy M&A season.

P.S. Check out our Voice Of The Customer Topic Page

Enterprise Feedback Management (EFM) Is Dead

Yes, the title is a bit extreme — but I wanted to get everyone’s attention.

I’ve been hearing a lot of people talk about Enterprise Feedback Management (EFM) lately; from analysts to conference speakers. Please stop; EFM is a description of the past.

As I discussed in the post Customer Insight and Action (CIA) Platforms Emerge, EFM is an outdated moniker for applications that support voice of the customer (VoC) programs. It’s like talking about music coming on cassettes. Let’s look at the words:

  • Enterprise. The focus of these efforts need to be on the customer, not the enterprise.
  • Feedback. The analysis needs to examine insight across a variety of inputs, not just feedback.
  • Management. The value of these efforts come from taking action, not from managing surveys.

In the Temkin Group report The Evolution Of Voice Of The Customer Programs we label the emerging class of applications as “Customer Insight and Action (CIA) Platforms” which we define as:

A technology for automating multi-channel customer feedback, analysis, and response and the related workflow associated with closed-loop voice of the customer (VoC) programs

If you’re wondering where VoC programs are heading, then check out the posts Voice Of The Customer Programs Grow Up or 6 Ds For Voice Of The Customer Programs.

How Is CIA Different Than EFM?

  • CIA pulls together a full picture of the customer. These applications examine a variety of inputs like who the customer is (often from CRM applications), what the customer has done and is doing (often from analytics and ERP applications), and everything that customer has told us (including call center interactions and sales notes).
  • CIA does not overly rely on surveys. EFM grew up as a platform for managing multiple surveys, but these structured data inputs are becoming a less dominant form of insight. As text analytics becomes a more mainstream capability, companies will tap into unstructured data sources at an increasing rate.
  • CIA focuses on operationalizing the insights. VoC programs provide value when companies take customer-insightful actions based on the insight. These applications need to focus on getting the right information into the hands of the right people at the right time for them to incorporate into their day-to-day activities.
  • CIA makes market research practices obsolete. In the post Market Research Needs An Overhaul, I discuss how new VoC programs challenge historical operating practices for market research organizations; putting pressure on these groups (inside of and outside of the enterprise) to deliver value, not just reports.
  • CIA cuts across technology categories. While EFM applications represented a technology niche serving market research groups, I expect that CIA will become mainstream business platforms. The ability to disseminate and act on customer insights offers a compelling value proposition that will likely evolve into a key infrastructure for many companies. Since it cuts across areas like CRM, BI (business intelligence), BPM (business process management), and customer analytics, look for the big boys (IBM, Oracle, SAP, Salesforce.com, etc.) to get active in this space very soon.

The bottom line: EFM was an evolutionary step on the way to CIA platforms.

Kana Buys Overtone; Sign Of Bigger Trends

Kana announced that it has acquired Overtone, a key social media and text analytics firm. While this acquisition seems like a good move for Kana (I’ll have more thoughts when I get a full briefing next week), it’s more significant as a sign of bigger trends.

My take: This acquisition is best understood in conjunction with a couple of other acquisitions by software companies that support customer-facing processes and channels:

Last year I published a report called the Eight Customer Experience Megatrends which provided my forecast about how these eight megatrends will play out in 2011:

The HiveLive/Radian6/Overtone moves are clear signs of two of these megatrends:

  • Unstructured data appreciation. All of the acquired vendors provide some amount of text analytics capabilities. The acquisitions link these capabilities with a lot of enterprise data — helping to push the envelope on where and how companies will extract insights from unstructured data such as sales notes, emails, and call recordings.
  • Social media assimilation. In the long run, it makes no sense for social media to be treated as its own channel (see my post: How Much Does Social Media Matter?). The acquiring vendors will help their clients link social media with other customer-facing processes and channels.

What’s next? I expect to see acquisitions by big vendors like Oracle, SAP, IBM, and Microsoft. A few interesting targets: Clarabridge, Attensity, and Nexidia.

The bottom line: Customer experience management remains an evolving field