Amazon and Apple Earn Top Customer Experience Ratings for Computers & Tablets

Temkin Experience RatingsWe recently released the 2017 Temkin Experience Ratings that ranks the customer experience of 331 companies across 20 industries based on a survey of 10,000 U.S. consumers.

Amazon (Kindle) and Apple deliver the best customer experience across computer & tablet makers, according to the 2017 Temkin Experience Ratings, an annual customer experience ranking of companies based on a survey of 10,000 U.S. consumers.

Amazon took the top spot out of the 12 computer and tablet makers included in this year’s ratings, earning a score of 74% and coming in 74th place overall out of 331 companies across 20 industries. Apple earned the second highest rating with a score of 68% and an overall rank of 189th.

Read more of this post

Apple and Sony Earn Top Customer Experience Ratings for Software Makers

Temkin Experience RatingsWe recently released the 2017 Temkin Experience Ratings that ranks the customer experience of 331 companies across 20 industries based on a survey of 10,000 U.S. consumers.

Apple and Sony deliver the best customer experience in the software industry, according to the 2017 Temkin Experience Ratings.

See our FAQs about the Temkin Experience Ratings.

Report: Tech Vendors: Product and Relationship Satisfaction, 2017

1701_ds_techproductsandrelationships_coverWe just published a Temkin Group data snapshot, Tech Vendors: Product and Relationship Satisfaction of IT Clients, 2017.

During Q3 of 2016, we surveyed 800 IT decision-makers from companies with at least $250 million in annual revenues, asking them to rate both the products of and their relationships with 62 different tech vendors. HPE outsourcing, Google, and IBM SPSS earned the top overall scores, while Trend Micro, Infosys, and SunGard received the lowest overall scores. To determine their product rating, we evaluated tech vendors across four product/service criteria: features, quality, flexibility, and ease of use. And we calculated their relationship rating using four different criteria: technical support, support of the account team, cost of ownership, and innovation of company. We also looked at how the average product and relationship scores of tech vendors have changed over the previous three years.

This research has a report (.pdf) and a dataset (excel). The dataset has the details of Product/Service and Relationship satisfaction for the 62 tech vendors as well as for several tech vendors with sample sizes too small to be included in the published report.

Download report for $495
(includes Excel spreadsheet with data)
BuyDownload3

Here’s a link to last year’s study.

The research examines eight areas of satisfaction; four that deal with products & services and four that examine relationships. Tech vendors earned the highest average satisfaction level for product features (64%) and the lowest for total cost of ownership (57%).

As you can see in the chart below, the overall product/service & relationship satisfaction ranges from a high of 76% for HPE outsourcing down to a low of 42% for Trend Micro.

1701_techproductrelationshipoverallresults

Read more of this post

Report: Tech Vendor NPS Benchmark, 2016 (B2B)

1609_technpsbenchmark_coverWe just published a Temkin Group report, Tech Vendor NPS Benchmark, 2016, The research examines Net Promoter Scores and the link to loyalty for 62 tech vendors based on feedback from 800 IT decision makers in large North American organizations. We also compared overall results to our benchmarks from the previous four years. Here’s the executive summary:

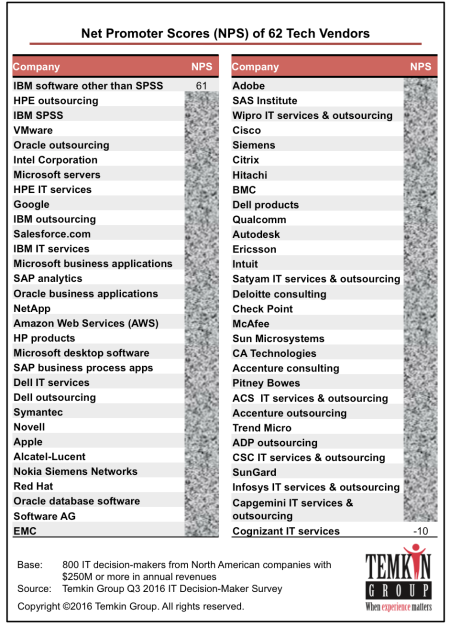
For the fifth year in a row, we examined the link between Net Promoter Scores® (NPS®) and loyalty for technology vendors. We surveyed 800 IT decision-makers from large North American firms to learn about their relationships with their technology providers. Of the 62 tech vendors we evaluated, IBM, HPE outsourcing, IBM SPSS, and VMware earned the highest NPS, while Cognizant, Capgemini, and Infosys received the lowest. Overall, the average NPS for the tech vendor industry decreased by almost 2 percentage points from last year. Our analysis shows that promoters are much more likely than detractors to increase their spending with tech vendors, try new products and services when they are announced, and forgive tech vendors after a bad experience. We also found that Software AG and HPE outsourcing are the top companies for purchase momentum, while IBM SPSS, IBM software, and IBM outsourcing have the highest Temkin Innovation Equity Quotient, and HPE outsourcing and IBM SPSS are at the top of the Temkin Forgiveness Ratings.

The report includes graphics with data for NPS, purchase intentions, likelihood to forgive, and likelihood to try a new offering. The excel spreadsheet includes this data (in more detail) for the 62 companies as well as for other tech vendors with less than 40 pieces of feedback. It also includes the summary NPS scores from 2015.

Download report for $695
(includes Excel spreadsheet with data)
BuyDownload3

As you can see in the chart below, the NPS ranges from a high of 61 for IBM software down to  a low of -10 for Cognizant IT services.

1609_techvendornpsclear

The industry average NPS decreased to 29.9 this year. The research also includes data for Purchase Momentum (how much customers are planning to buy), Temkin Forgiveness Ratings (likelihood of customers to forgive after a bad experience), and Temkin Innovation Equity Quotient (likelihood of customer to try a new offering). We not only list the results for each company, but we also show that NPS is highly correlated to each of these items (as you can see below for Purchase Momentum).

1609_techvendornpstrendandcorrelatoin

Report details: When you purchase this research, you will receive a written report and an excel spreadsheet with more data. The report includes graphics with data for NPS, purchase momentum, Temkin Forgiveness Ratings, and Temkin Innovation Equity Quotient for the 62 tech vendors that had at least 40 pieces of feedback. The excel spreadsheet includes this data (in more detail) for the 62 companies as well as for other tech vendors with less than 40 pieces of feedback. It also includes the summary NPS scores from 2015. If you want to know more about the data file, download this SAMPLE SPREADSHEET without the data (.xls).

Download report for $695
(includes Excel spreadsheet with data)
BuyDownload3

Note: See our 2015 NPS benchmark2014 NPS benchmark2013 NPS benchmark and 2012 NPS benchmark for tech vendors as well as our page full of NPS resources.

P.S. Net Promoter Score, Net Promoter, and NPS are registered trademarks of Bain & Company, Satmetrix Systems, and Fred Reichheld.

Google and Symantec Earn Top Customer Experience Ratings for Software Firms

Temkin Experience Ratings

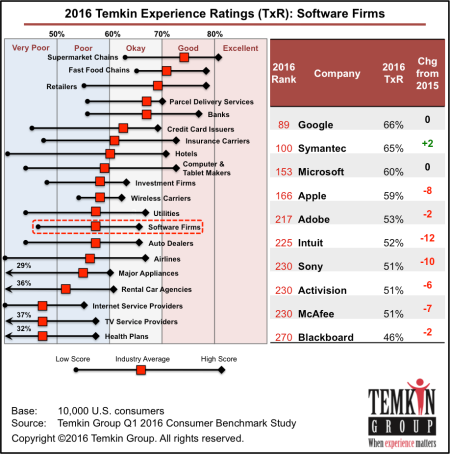
We recently released the 2016 Temkin Experience Ratings that ranks the customer experience of 294 companies across 20 industries based on a survey of 10,000 U.S. consumers.

Of the 10 software firms we looked at, Google earned the highest score for the second year in a row with a rating of 66%, putting it in 89th place overall out of 294 companies across 20 industries. Symantec came in a close second with a rating of 65% and a rank of 100th overall. Additionally, Symantec was the only software firm to improve its rating between 2015 and 2016, increasing by two percentage points.

1605_Software_Rank

Read more of this post

Amazon, Barnes & Noble, and Hewlett-Packard Earn Top Customer Experience Ratings for Computers and Tablets

Temkin Experience Ratings

We recently released the 2016 Temkin Experience Ratings that ranks the customer experience of 294 companies across 20 industries based on a survey of 10,000 U.S. consumers.

Amazon (Kindle), Barnes & Noble (Nook), and Hewlett Packard deliver the best customer experience in the computer and tablet industry, according to the 2016 Temkin Experience Ratings, an annual ranking of companies based on a survey of 10,000 U.S. consumers.

Amazon took the top spot for the second year in a row, earning a rating of 73% and placing 28th overall out of 294 companies across 20 industries. Barnes & Noble and Hewlett-Packard tied for the distant second spot out of 12 firms in the industry, each receiving a rating of 61% and an overall rank of 142nd.

At the other end of the spectrum, eMachines and Compaq tied for the lowest-rated computer and tablet maker, each with a rating of 44% and an overall ranking of 278th.

Overall, the computer and tablet industry averaged a 59% rating in the 2016 Temkin Experience Ratings and came in 9th place out of 20 industries. The average rating of the industry decreased by four percentage-points between 2015 and 2016, dropping from 63% to 59%.

1605_CompTab_Rank

Here are some additional findings from the computer and tablet industry: Read more of this post

Modernize Leadership: Steve Jobs Demonstrates Purpose and Values

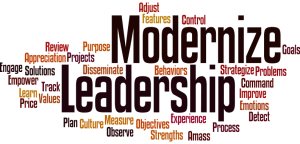
wordle4bIn a recent post, I discussed how management practices have become outdated and that there’s a strong need to Modernize Leadership. This change requires eight distinct shifts in how we lead organizations.

I just ran into this great video of a speech that Steve Jobs gave in September 1997. It’s really worth watching. Jobs demonstrates a few of the elements that I discuss in Modernize Leadership, and in particular he does a great job of highlighting this necessary shift:

5) Goals and Objectives to Purpose and Values

The bottom line: Tap into your purpose and values to drive simplicity

Report: Tech Vendors: Product and Relationship Satisfaction, 2016

1601_DS_TechProductsAndRelationships_COVERWe just published a Temkin Group data snapshot, Tech Vendors: Product and Relationship Satisfaction of IT Clients, 2016.

During Q3, 2015, 800 IT professionals from companies with at least $250 million in annual revenues rated both the products of and their relationships with 62 tech vendors. The research examines satisfaction with eight areas: product/service features, product/service quality, product/service flexibility, product/service ease of use, technical support, support of the account team, cost of ownership, and innovation of company. Some of the findings include that Intel, Google, and HP outsourcing earned the highest overall satisfaction ratings, while Unisys, Sage, and Cognizant IT services earned the lowest. When it comes to product satisfaction, Intel leads in product features, Apple and IBM IT services lead in product quality, Google leads in product flexibility, and NetApp leads in product ease of use. When it comes to relationship satisfaction, HP outsourcing leads in tech support and in cost of ownership, Intel leads in account team support, and Google leads in innovation.

This product has a report (.pdf) and a dataset (excel). The dataset has the details of Product/Service and Relationship satisfaction for the 62 tech vendors as well as for several tech vendors with sample sizes too small to be included in the published report.

Download report for $495
(includes Excel spreadsheet with data)
BuyDownload3

As you can see in the chart below, the overall product/service & relationship satisfaction ranges from a high of 74% for Intel down to a low of 46% for Unisys.

1601_ProductRelationshipSatisfaction_Ratings

The chart below shows the average scores across all satisfaction criteria. Tech vendors scored the highest in innovation (64%) and the lowest in cost of ownership (56%).1601_ProductRelationshipSatisfaction_Elements

Report details: When you purchase this research, you will receive a written data snapshot and an excel spreadsheet with more data.The dataset has the details of Product/Service and Relationship satisfaction for the 62 tech vendors as well as for several tech vendors with sample sizes too small to be included in the published report. If you want to know more about the data file, download this SAMPLE SPREADSHEET without the data (.xls).

Download report for $495
(includes Excel spreadsheet with data)
BuyDownload3

Report: Tech Vendor NPS Benchmark, 2015 (B2B)

1509_IT_NPSBenchmark_COVERWe just published a Temkin Group report, Tech Vendor NPS Benchmark, 2015, The research examines Net Promoter Scores and the link to loyalty for 62 tech vendors based on feedback from IT decision makers in large North American organizations. We also compared overall results to our benchmarks from the previous three years. Here’s the executive summary:

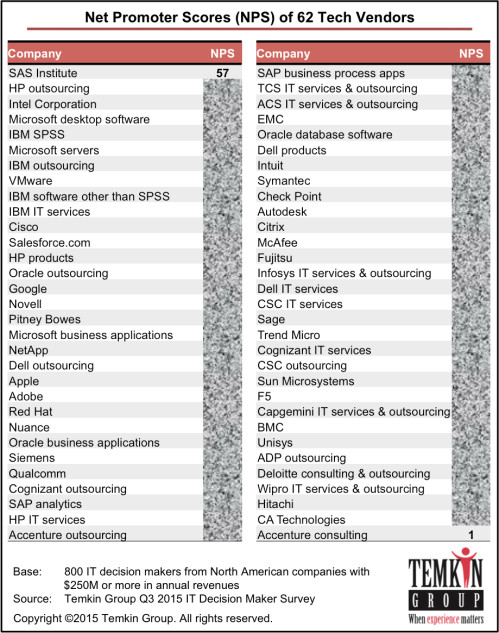
To examine the link between Net Promoter Scores® (NPS®) and loyalty, we surveyed 800 IT decision-makers from large North American firms to learn about their relationships with their technology providers. Of the 62 tech vendors we evaluated, SAS Institute, HP outsourcing, and Intel earned the highest NPS, while Accenture, CA Technologies, and Hitachi received the lowest. Overall, the tech vendor industry’s average NPS jumped to 31.8 in 2015—an increase of more than eight points—after two straight years of declining scores. Our analysis shows that promoters are much more likely than detractors to spend more money with tech vendors, try new products and services when they are announced, and forgive their tech vendors after a bad experience. Our results also revealed that SAS Institute and Cognizant outsourcing were the top companies for purchase momentum, IBM SPSS and Intel have the highest Temkin Innovation Equity Quotient, and HP outsourcing and Intel scored the highest in the Temkin Forgiveness Ratings.

The report includes graphics with data for NPS, purchase intentions, likelihood to forgive, and likelihood to try a new offering. The excel spreadsheet includes this data (in more detail) for the 62 companies as well as for 25 other tech vendors with less than 40 pieces of feedback. It also includes the summary NPS scores from 2014.

Download report for $695
(includes Excel spreadsheet with data)
BuyDownload3

As you can see in the chart below, the NPS ranges from a high of 57 for SAS Institute down to  a low of 1 for Accenture consulting.

1509_TechNPS_Listing

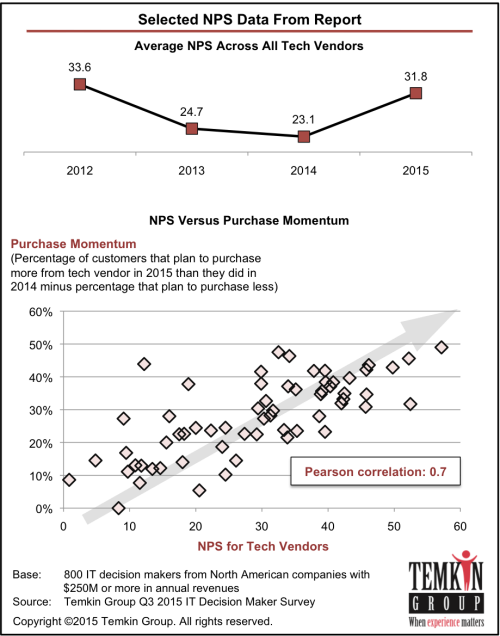
After declining for the past two years, the industry average NPS increased to 31.8 this year, almost reaching the level from our initial study in 2012. The research also includes data for Purchase Momentum (how much customers are planning to buy), Temkin Forgiveness Ratings (likelihood of customers to forgive after a bad experience), and Temkin Innovation Equity Quotient (likelihood of customer to try a new offering). We not only list the results for each company, but we also show that NPS is highly correlated to each of these items (as you can see below for Purchase Momentum).

1509_TechNPS_TrendPurchase

Report details: When you purchase this research, you will receive a written report and an excel spreadsheet with more data. The report includes graphics with data for NPS, purchase momentum, Temkin Forgiveness Ratings, and Temkin Innovation Equity Quotient for the 62 tech vendors that had at least 40 pieces of feedback. The excel spreadsheet includes this data (in more detail) for the 62 companies as well as for 25 other tech vendors with less than 40 pieces of feedback. It also includes the summary NPS scores from 2014. If you want to know more about the data file, download this SAMPLE SPREADSHEET without the data (.xls).

Download report for $695
(includes Excel spreadsheet with data)
BuyDownload3

Note: See our 2014 NPS benchmark2013 NPS benchmark and 2012 NPS benchmark for tech vendors as well as our page full of NPS resources.

P.S. Net Promoter Score, Net Promoter, and NPS are registered trademarks of Bain & Company, Satmetrix Systems, and Fred Reichheld.

Amazon Kindle Leads Computers and Tablets in Customer Experience

We recently released the 2015 Temkin Experience Ratings that ranks the customer experience of 293 companies across 20 industries based on a survey of 10,000 U.S. consumers.

Amazon (Kindle) and Apple deliver the best customer experience in the computer and tablet industry, according to the 2015 Temkin Experience Ratings, an annual ranking of companies based on a survey of 10,000 U.S. consumers. Amazon took the top spot with a rating of 76%, placing it 41st overall out of 293 companies. Apple came in second with a rating of 68% and an overall ranking of 119th.

While the Temkin Experience Ratings have included computer makers for five years, it added tablets to this category in 2015. Amazon’s Kindle—a newcomer to the Ratings—unseated Apple as the highest-scoring computer and tablet maker, a position Apple had held for the previous three years.

At the other end of the spectrum, Lenovo and Asus tied for the lowest-rated computer and tablet maker, each with a rating of 55% and an overall ranking of 245th. Lenovo dropped six percentage-points from 2014, while this is the first year that Asus has been included in the Ratings.

Overall, the computer & tablet industry averaged a 63% rating in the 2015 Temkin Experience Ratings and tied for 11th place out of 20 industries. It was also one of only 5 industries to improve its rating over the past year, increasing its average by 1.2 percentage points.

Here are some additional findings:

  • The ratings of all computer makers in the 2015 Temkin Experience Ratings are as follows: Amazon (76%), Apple (68%), Hewlett-Packard (64%), Barnes & Noble (60%), Toshiba (60%), Sony (60%), Acer (57%), Dell (57%), Lenovo (55%), and Asus (55%).
  • Sony (+5 points) and Apple (+1 point) were the only companies in this industry to improve their ratings between 2014 and 2015.
  • Lenovo (-6 points), Acer (-4 points), and Dell (-2 points) declined by the most percentage-points between 2014 and 2015.

Read more of this post

Apple and Google Lead Software Industry in Customer Experience

We recently released the 2015 Temkin Experience Ratings that ranks the customer experience of 293 companies across 20 industries based on a survey of 10,000 U.S. consumers.

Here are some highlights from the Ratings for software firms:

  • Apple and Google tied for the highest score in the software industry, each scoring 66% and ranking 136th overall. Apple’s score declined by two percentage-points from last year, while Google’s increased by one point.
  • Blackboard dropped seven points between 2014 and 2015—from 54% last year to 47% this year—making it the lowest ranked software company for the second year in a row. It was also the only software company to score a “very poor” rating.
  • Blackboard received the lowest TxR component ratings in all three categories, falling more than 10 percentage-points below the industry average in each one. It fell 10.2 points below industry average in success, 14.5 points below industry average in effort, and 14.1 points below industry average in emotion.
  • The average rating for software firms dropped 2.4 percentage-points in the last year, down from 63% in 2014 to 60% in 2015.
  • In addition to the overall rating, the average score of each component decreased between 2014 and 2015. In 2014 the industry average for success was 68%, now it is 66%. Likewise, the average score for effort dropped from 65% to 63%, and the average score for emotion dropped from 55% to 53%.
  • Apple earned the highest score for both the success and emotion components, scoring 72% and 60% respectively. Google, meanwhile, scored the highest for the effort component with 70%.
  • Google and Intuit were the only two software firms to have increased their score over the past year; however, each only improved by one percentage-point. Google went from 65% to 66% over the past year, and Intuit went from 63% to 64%.
  • Although Activision fell below the industry average for both the success and effort component, it scored 2.4 percentage-points higher than the industry average for the emotion component. Sony, on the other hand, scored above industry average for both effort and emotion, but scored 2.9 percentage-points below average for the success component.

Read more of this post

Congrats To Industry Leaders in Customer Service

Since today is the last day of Customer Service Week, I’m give a shout out to industry leaders in the 2014 Temkin Customer Service Ratings. The chart below shows the leaders across 19 industries, along with where they ranked compared with the 233 companies in the ratings.

1410_TCSR_IndustryLeaders

The bottom line: Happy Customer Service Week!


Report: Tech Vendor NPS Benchmark, 2014

1407_IT_NPSBenchmark_COVERWe just published a Temkin Group report, Tech Vendor NPS Benchmark, 2014, The research examines Net Promoter Scores and the link to loyalty for 63 tech vendors based on feedback from IT decision makers. We also compared overall results to our 2013 NPS benchmark and our 2012 NPS benchmark. Here’s the executive summary:

We surveyed IT decision-makers from more than 800 large North American firms to learn about their relationships with their tech vendors. We asked them a series of questions regarding their experiences as the clients of different tech vendors, and one of the questions we posed generated Net Promoter Scores® (NPS®) for the companies. Of the 63 companies we looked at, EDS and VMware earned the highest NPS, while Autodesk and Cognizant received the lowest. The overall industry average NPS dropped for the second year in a row. Our analysis also delved into the correlation between NPS and loyalty, revealing that, compared to severe detractors, promoters are much more likely to spend more money with their tech vendors in 2014, try new products and services when they are announced, and forgive the vendor for a mistake. We compared the loyalty levels for each vendor, and we found that SunGard and IBM software have the most customers planning on increasing their purchases in 2014, while Satyam and EDS customers are the most willing to try new offerings, and Satyam has the most forgiving customers. Our research also shows that promoters are more concerned than detractors about getting lower prices.

Download report for $695 (includes Excel spreadsheet with data)
BuyDownload3

This is the third year that Temkin Group has completed the NPS study. Over that time, the average NPS in the tech industry has been dropping. NPS in for tech vendors was 33.6 in 2012 and 24.7 in 2013, falling to 23.1 in 2014.

With an NPS of 48, EDS came out with the top score followed closely by VMware with 45. Six other tech vendors received NPS of 35 or more: EMC, Microsoft servers, Oracle outsourcing, Pitney Bowes, Microsoft business applications, and Cisco.

At the other end of the spectrum, three tech vendors have negative NPS: Autodesk, Cognizant, and Wipro. Six other vendors fell below 10: Capgemini, Intuit, ADP outsourcing, CA, Infosys, and HP outsourcing.

1407_ITNPS_Companies

The report also examines the link between NPS and loyalty. Our analysis shows that promoters are more than six times likely to forgive a tech vendor if they deliver a bad experience, about seven times as likely to try a new offering from the company, and almost three times as likely to purchase more from them in 2014 than they did in 2013.

In addition to benchmarking NPS, the research measures the loyalty that large companies have for their tech vendors. Respondents have the most plans to increase spending with SunGard, IBM software, Alcatel-Lucent, and ACS. They are most likely to try new offerings from Satyam, EDS, and EMC. And if the tech vendors make a mistake, IT decision makers are most likely to forgive Satyam, EDS, Ericsson, and Alcatel-Lucent. NPS characterizes respondents as Promoters when they are very likely to recommend and Detractors when they are very unlikely to recommend.

Report details: The report includes graphics with data for NPS, 2014 purchase intentions, likelihood to forgive, likelihood to try a new offering, and areas of improvement for the 63 tech vendors that had at least 40 pieces of feedback. The excel spreadsheet includes this data (in more detail) for the 63 companies as well as for 22 other tech vendors with less than 40 pieces of feedback. It also includes the summary NPS scores from 2013. If you want to know more about the data file, download this excel spreadsheet without the data.

Download report for $695 (includes Excel spreadsheet with data)
BuyDownload3

The bottom line: When it comes to NPS, large tech vendors are heading in the wrong direction

Note: See our 2013 NPS benchmark and 2012 NPS benchmark for tech vendors as well as our page full of NPS resources.

P.S. Net Promoter Score, Net Promoter, and NPS are registered trademarks of Bain & Company, Satmetrix Systems, and Fred Reichheld.

Amazon Provides Best Technical Support

We examined the service and support delivered by the following technology providers:

  • Amazon (e.g., Kindle, Kindle Fire, Kindle Fire HD, Amazon Prime)
  • Apple (e.g., iPhone, iPad, iTunes, iCloud, MacBook)
  • Google (e.g., Search, Google Docs, Gmail, YouTube, Google Play, Google Drive)
  • Sony (e.g., PlayStation 3, PlayStation 4)
  • Microsoft (e.g., XBOX, WINDOWS, MSOffice, and Skype)
  • Nintendo (e.g., Wii, Wii U)
  • Samsung (e.g., Galaxy Phones, Galaxy Tablets, Galaxy Note)

We asked consumers who had recent service or support experience to rate those vendors in two areas:

  1. Thinking about your recent customer service or technical support experience from these companies, how would you rate the end-to-end experience from your first attempt to get help until your issue was resolved?
  2. How would you rate the overall quality of online resources provided by these companies for end user support (e.g., websites, chat, contact us, FAQs)?

As you can see in the graphic below, less than half of consumers rated any of the companies “excellent.” Some other tidbits:

  • Amazon.com is on top for end-to-end service as well as for its online resources.
  • Apple provides the second best end-to-end service, but the worst online resources.
  • Google is next to the bottom in both categories.
  • Microsoft is the lowest scoring for end-to-end service, but third from the bottom for its online resources.

1407_TechSupport1

The bottom line: Consumers could use better support for their technology.

Apple Leads Computer Industry in 2014 Temkin Experience Ratings

We recently released the 2014 Temkin Experience Ratings that ranks the customer experience of 268 companies across 19 industries based on a survey of 10,000 U.S. consumers.

Apple took the top spot with a rating of 67%, placing it 119th overall out of 268 companies across 19 industries, while Hewlett-Packard came in a close second with a rating of 64% and an overall ranking of 144th. This is Apple’s fourth straight year as the highest-rated computer maker, and Hewlett-Packard maintained its second-place position from last year. At the other end of the spectrum, Sony and Compaq tied for the lowest-rated computer maker, each with a rating of 55% and overall ranking of 232nd. While Sony was also on the bottom in 2013, this is the lowest ranking that Compaq has ever received.

Download entire dataset for $395

ComputersA
Here are some additional findings from the airline industry: Read more of this post