H-E-B and Trader Joe’s Earn Highest Emotion Ratings

In a previous post, I defined the three elements of an experience: Success, Effort, and Emotion.

Emotion is a significant blind spot for most organizations. In the Temkin Group report State of CX Metrics, 2013, we found that only 11% of large companies feel that they do a very good job of measuring customers’ emotional responses. Our ROI of Customer Experience, 2014 shows that emotion is the most significant driver of loyalty, especially when it comes to consumers recommending firms to their friends.

We’ve been measuring emotion as part of our Temkin Experience Ratings for four years. Our emotion rating is based on asking consumers the following question:

Thinking of your most recent interactions with each of these companies, how did you feel about those interactions?

Responses range from 1 (upset) to 7 (delighted) and the emotion rating is calculated as the percentage of consumers who select 6 or 7 minus the percentage who select 1, 2, or 3.

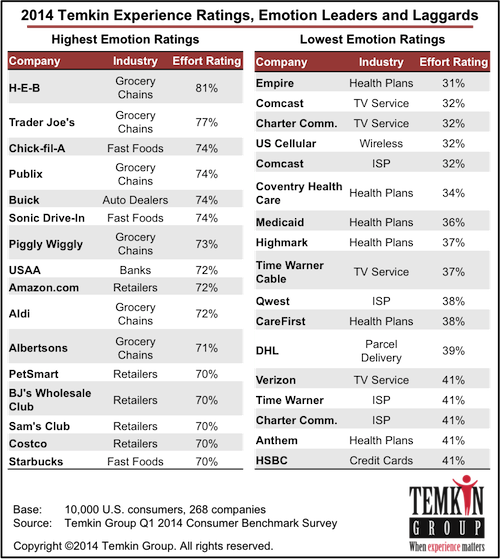
As you can see in the list of leaders and laggards below (from ratings of 268 companies across 19 industries based on a survey of 10,000 U.S. consumers), H-E-B earned the highest overall emotion rating of 84%, outpacing second place Trader Joe’s by three points.

At the other end of the spectrum, Empire BCBS earned the l0west rating of 31% and several companies were just slightly better with 32%: Comcast (Internet and TV service), Charter Communications, and US Cellular.

1411_EmotionLeadersLaggards

The bottom line: Stop ignoring how your customers feel.

H-E-B Earns Highest Effort Rating, Medicaid Earns Lowest

In a previous post, I defined the three elements of an experience: Success, Effort, and Emotion. We’ve been measuring each of these areas as part of our Temkin Experience Ratings for four years. So I decided to share some insights from the effort ratings component of those overall ratings (you can see this data as part of the Temkin Experience Ratings datasets).

As you can see in the charts below (from ratings of 268 companies across 19 industries based on a survey of 10,000 U.S. consumers):

  • H-E-BFood LionBurger KingChick-fil-APublixcredit unionsSonic Drive-InTrader Joe’sDairy QueenKroger, Little Caesar’sStarbucksPiggly Wiggly, and Regions have the highest effort ratings.
  • MedicaidEmpire (BCBS), Coventry Health CareHighmark (BCBS), Motel 6Super 8Residence InnHitachiHaierComcastUS Airways, and Chrysler have the lowest effort ratings.
  • Grocery chains and fast food chains have the highest average effort ratings while health plans, TV service providers, Internet service providers, and hotels have the lowest.
  • Led by a five point improvement in credit cards, 13 out of the 19 industries improved between 2013 and 2014.
  • Hotels dropped eight points from 2013 to 2014, by far the largest of the three industries that declined. the others: parcel delivery services and retailers.

Read more of this post

USAA and Capital One 360 Top 2014 Temkin Web Experience Ratings

We just published the 2014 Temkin Web Experience Ratings, the fourth year of the ratings. It uses feedback from 10,000 U.S. consumers to rate 222 organizations across 19 industries.

Download dataset for $295

USAA’s banking business took the top spot and Capital One 360 (formerly ING Direct) earned the second highest rating in the 2014 Temkin Web Experience Ratings, which rates 222 companies across 19 industries. USAA’s insurance and credit card businesses tied for third place.Rounding out the top 13 companies in the ratings are Charles Schwab, Amazon.com, credit unions, TD Bank, U.S. Bank, Sheraton, Ace Hardware, eBay, and Nordstrom.

The award for delivering the worst web experience goes to Coventry Health Care, followed closely by Medicaid. Four of the bottom 14 organizations are health plans and three are TV service providers. The remaining companies in the bottom 14 of the Temkin Web Experience Ratings are Charter Communications, Comcast (TV service and Internet service), Dunkin’ Donuts, Time Warner Cable (TV service and Internet service), Jack in the Box, CareFirst, MetroPCS, Highmark, Adobe, and Wendy’s.

1406_TWER_BestWorst

Here’s how the industries compare with each other:

1406_TWER_Industries

The 2014 Temkin Web Experience Ratings shows that companies have made improvements in web experience between 2013 and 2014. Led by airlines, which increased by nearly 15 percentage points since last year, 17 of 19 industries improved. The two industries that earned lower ratings in 2014 are parcel delivery services and rental cars.

Nearly two-thirds of the 195 organizations that were in both the 2013 and 2014 Temkin Web Experience Ratings improved this year. On average, firms earned an increase of 3.2 percentage points. Eleven companies improved by more than 15 percentage points: Southwest Airlines, Health Net, United Airlines, PetSmart, AOL, Sony, Bright House Networks, Morgan Stanley Smith Barney, Edward Jones, Cablevision, and AAA.

Six companies saw their Temkin Web Experience Ratings fall by 10 points or more between 2013 and 2014: Dunkin’ Donuts, Avis, Hertz, Jack in the Box, Dollar, and Blackboard.

1406_TWER_IncreaseDecrease

Methodology:

The data was collected from an online survey of 10,000 U.S. consumers during January 2014. Quotas were set to mirror the U.S. census data for age, income, gender, ethnicity, and geographic regions of the U.S. population.

Temkin Web Experience Ratings are based on asking consumers the following question about companies with whom they’ve had a customer service interaction during the previous 60 days: “Thinking back to your most recent interaction with the websites of these companies, how satisfied were you with the experience?” Potential responses range from 1= “very dissatisfied” to 7= “very satisfied.” Temkin Web Experience Ratings are calculated by taking the percentages of consumers who respond with a 6 or 7 and subtracting the percentage who respond with 1, 2, or 3.

Download dataset for $295

Temkin Ratings website
You can view a sortable list of results from the Temkin Web Experience Ratings as well as other ratings on the Temkin Ratings website.


Report: What Happens After a Good or Bad Experience, 2014

1402_WhatHappensAfterGoodBadExperiences_COVERWe just published a Temkin Group report, What Happens After a Good or Bad Experience, 2014. The report, which includes 19 data charts, examines which companies and industries provide the most bad experiences, what impact those experiences have on spending, and how the negative impacts of bad experiences can be mitigated by good service recovery. The report also examines how consumers share their good and bad experiences with companies as well as with other people. Here’s the executive summary:

To understand the effect of good and bad experiences, we asked 10,000 U.S. consumers about their recent interactions with 268 companies across 19 industries. Results show that Internet services and TV services are the industries most likely to deliver a bad experience to their customers, while grocery chains are the least likely to. At the company level, Scottrade had the smallest percentage of customers reporting a recent bad experience with the company and Time Warner Cable had the highest. More than half of the customers who encountered a bad experience at a fast food chain, credit card issuer, grocery store, or hotel either decreased their spending with the company or stopped altogether. However, our data shows that a good service recovery effort can help mitigate a bad experience. Unfortunately, many firms—especially in the banking, Internet services, and TV services sectors—aren’t very good at service recovery. In addition to the consequences of bad interactions, we also examined which channels customers use to share their good and bad experiences and how these changed across age groups. We then compared these results to survey responses from the past two years. We also uncovered a negative bias inherent in how customers provide feedback. ING Direct, Residence Inn, and Fairfield Inn have the most negative bias in the feedback they receive directly from customers, while Hy-Vee and Hyundai have the most negative bias on Facebook. 

Click link to see full list of industries and companies covered in this report (.pdf).

Download report for $195
BuyDownload3

One of the most interesting analyses in the report is the look at how service recovery after a bad experience affects the spending pattern of consumers. Here’s a summary of one of the charts showing just how important it is for a company to recover well after making a mistake:

1402_EconomicsOfServiceRecovery

Here are some other insights from the research:

  • Sixteen percent of consumers who have interacted with TV service and Internet service providers report having a bad experience over the previous six months. Next on the list are wireless carriers, with 12% of their customers reporting a bad experience. At the other end of the spectrum, only 3% of consumers report a bad experience with grocery chains and 4% report having a bad experience with fast food chains.
  • The five companies with the most customers reporting bad experiences are Time Warner Cable (25%), Motel 6 (22%), Coventry Health Care (21%), and Comcast (21%). There were 10 companies with only 1% or less of their customers reporting bad experiences: Scottrade, Chick-fil-A, H.E.B., Whole Foods, ShopRite, ING Direct, Starbucks, Trader Joe’s, Vanguard, and True Value.
  • More than one-quarter of consumers who have a bad experience stop spending with computer makers, car rental agencies, credit card issuers, hotel chains, and software companies. The impact of bad experiences is less costly for parcel delivery services, wireless carriers, health plans, TV service providers, Internet service providers, and grocery chains, as less than 15% of their customers with bad experience stopped spending.
  • The industries that are the best at responding to a bad experience are investment firms, major appliances, retailers, and car rental agencies. The industries that are the worst at responding to a bad experience are TV service providers, wireless carriers, Internet service providers, parcel delivery services, and health plans.
  • Thirty-two percent of consumers give feedback directly to companies after a very bad experience and 23% give feedback after a very good experience.
  • Overall, 25- to 34-year-olds are the most likely to share feedback about their experiences. After a good experience 57% tell a friend directly, 28% share on Facebook, and 18% put a comment or rating on a review site. After a bad experience, 60% tell a friend directly, 31% share on Facebook, and 20% write a review.

Download report for $195
BuyDownload3

The bottom line: Make sure to recover quickly after a bad experience

Companies Don’t Earn The Loyalty Their CX Deserves

Our report The ROI of Customer Experience shows that customer experience is highly correlated to loyalty. The research analyzed the relationship between Temkin Loyalty Ratings and Temkin Experience Ratings (TER) for 206 U.S. companies.

After analyzing the connection between these ratings, we found that some companies seem to have higher loyalty levels than they seem to deserve based on their customer experience while others have lower loyalty levels.

Using that dataset, I compared actual loyalty levels with projected loyalty levels. How? By plugging each company’s experience rating into our regression model to identify what their loyalty rating should be (normalized to their industry average) based on its TER and compared that projected rating with its actual loyalty rating. In the chart below you can see the companies with the largest positive and negative variances from the model’s projections.

The companies with loyalty levels the most above the projections are USAA, Highmark, Medicaid, credit unions, and TriCare. The companies that fall the most below the projections are T-Mobile, BMW, Bosch, AT&T, and Alamo.

Let’s examine USAA as an example. Since it has very high experience ratings compared with its industry peers, our model projects that its loyalty ratings should be at the high end of banks, credit card issuers, and insurance carriers. This analysis shows that USAA’s actual loyalty levels are higher than expected, even after factoring in its wonderful customer experience.

So what?!? There’s nothing inherently good or bad with being above or below the projected loyalty level. There’s no reason to expect companies to fall directly on their projected loyalty levels.

What’s interesting about this analysis is not what’s good or bad, but WHY are some companies so far away from the projected levels. This is where I’ll leave the data behind and offer my interpretation about WHY some companies have higher than projected loyalty while others have lower than projected loyalty:

  • Product fit. CX is not the only component of customer value. Companies that have tailored their products and services to better meet customers’needs (like USAA and TriCare) have an even better loyalty level than their CX would suggest. If companies have a poor product offering, then their loyalty may be lower than projected (this may explain Sears and DHL).
  • Product quality. If companies have quality problems with their offerings, then they would have lower loyalty levels than their CX deserve (this may explain AT&T, T-Mobile, and Alamo).
  • Service expectations. Companies that have premium status (BMW cars and Bosch appliances) often elicit higher expectations from customers, so they don’t earn the loyalty that their CX would suggest and have to work harder.
  • Trapped customers. In industries where customers have a hard time switching, a bad experience may not lead to the loyalty decline anticipated by the model; the same type of situation would occur if a company is harder to move away from than it’s competitors (this may explain Medicaid, Medicare, MSN, and EarthLink).
  • Commoditization. In industries that have a lot of pricing comparisons, customers may overly focus on price and not award good customer experience with the level of loyalty that the model projects (this may explain Alamo). It can also push consumers that have poor experience to more quickly leave a company for its competitor (this may explain DHL).
  • Substitutions. In sitations where customers don’t have a lot of clear alternatives, they will be more loyal to a company than the model suggests (this may explain eBay). A company that relies on self-service may be seen as easier to move from than a company that forms more personal connections with customers (this may explain E*TRADE).
  • Emotionality. Sometimes customers develop a strong affinity for a brand that increases loyalty and dampens the negative effect of any poor experiences (this may explain Southwest Airlines and Apple).

These items cover three broad topics: offerings, competitive environment and customer expectations. What do you think causes companies to earn more or less loyalty than their customer experience seems to deserve?

The bottom line: CX is correlated to loyalty, but other things matter as well

Report: 2012 Temkin Loyalty Ratings

Access the data from all Temkin Ratings research at the Temkin Ratings website.

We just published a new Temkin Group report, 2012 Temkin Loyalty Ratings. The report analyzes feedback from 10,000 U.S. consumers to rate their loyalty to 206 organizations across 18 industries. Congratulations to the top firms in this year’s ratings: Sam’s ClubAldi, USAA, Publix, credit unions, and Amazon.com.

We added six industries (fast food chains, grocery chains, major appliances, car rental agencies, auto dealers, and parcel delivery services) and 63 companies compared with the 2011 Temkin Loyalty Ratings.

Here is the executive summary from the report:

Sam’s Club, Aldi, and USAA earned the top spots in the 2012 Temkin Loyalty Ratings while Citigroup (banking and credit cards) and Charter Communications (TV service and Internet service) each show up twice in the bottom four. We asked 10,000 U.S. consumers to rate their loyalty to companies across three dimensions: likely to recommend, reluctant to switch, and willing to repurchase. Their responses allowed us to rate the loyalty of customers to 206 companies across 18 industries. One-quarter of companies have “strong” or “very strong” ratings while 50% have “weak” or “very weak” ratings. At an industry level, grocery chains and retailers have the most loyal customers while internet service providers and TV service providers have the least loyal customers. USAA has the most loyal customers across three industries, banking, insurance, and credit cards. When comparing the results from the 2011 and 2012 Temkin Loyalty Ratings, we find that PNC and USAA improved the most and Kohl’s and Hyatt declined the most.

Download report for $195

The Temkin Loyalty Ratings are based on evaluating three components of loyalty:

  1. Recommending: How likely are consumers to recommend the company to friends and colleagues?
  2. Switching: How reluctant are consumers to switch business away from the company?
  3. Repurchasing: How willing are customers to purchase additional products and services from the company?

Here are the ratings for all 206 companies:

Here’s how the industries compare with each other:

Here are some other highlights from the research:

  • USAA (in their banking and credit card divisions) as well as credit unions (banking) outpaced their industry peers by more than 25 percentage points.
  • DHL and RadioShack are the furthest behind their peers, falling more than 20 percentage points below their industry averages.
  • Across the 12 industries we examined in both years, nine earned higher loyalty scores in 2012 and three showed a decline. Computer makers are at the top of the list of gainers while retailers had the largest decline.
  • Of the 139 companies that are included in both the 2011 and 2012 Temkin Loyalty Ratings, 84 firms made at least a small improvement in their scores. Led by PNC and USAA, 19 companies earned double-digit improvements over the last year.
  • Kohl’s and Hyatt are the only companies that declined by more than 10 percentage points over the previous year.

Download report for $195

Do you want to see the data? Go to the Temkin Ratings website where you can sort through all of the results for free. You can even purchase the underlying data if you want to get more access.

The bottom line: Consumer loyalty remains up for grabs across most industries.

Report: 2012 Temkin Experience Ratings

Access the data from all Temkin Ratings research at the Temkin Ratings website.

We just published a new report, 2012 Temkin Experience Ratings. The report analyzes feedback from 10,000 U.S. consumers to rate 206 organizations across 18 industries. Congratulations to the top firms in this year’s ratings: Sam’s ClubPublix, Starbucks, Subway, Chick-fil-A, Aldi, Winn-Dixie, H.E.B, and credit unions.

We added six industries (fast food chains, grocery chains, major appliances, car rental agencies, auto dealers, and parcel delivery services) and 63 companies compared with the 2011 Temkin Experience Ratings.

Here is the executive summary from the report:

Sam’s Club and Publix earned the top two spots in the 2012 Temkin Experience Rankings, with three fast food chains rounding out the top five. We asked 10,000 U.S. consumers to rate their recent interactions with companies across three dimensions of their experience: functional, accessible, and emotional. Their responses allowed us to rate 206 companies across 18 industries. Only 28% of those companies received at least a “good” rating. Grocery chains earned the highest average scores and health plans dominated the bottom of the ratings. Kaiser Permanente and credit unions most outperformed their industries while DHL and RadioShack fell the farthest behind their peers. None of the companies earned an “excellent” rating for the emotional component, while Charter Communications and Earthlink lead 10 companies falling below the “very poor” threshold in that area. Compared with last year’s ratings, most industries improved, led by a 5.3 point average increase by insurance carriers. When it comes to changes over the past year by individual firms, PNC and Lenovo improved the most while Regions Bank had the sharpest decline.

Download report for FREE

The Temkin Experience Ratings are based on evaluating three elements of experience:

  1. Functional: How well do experiences meet customers’ needs?
  2. Accessible: How easy is it for customers to do what they want to do?
  3. Emotional: How do customers feel about the experiences?

Here are the ratings for all 206 companies:

Here’s how the industries compare with each other:

Here are the companies that are leaders across the 18 industries:

Download report for FREE

Do you want to see the data? Go to the Temkin Ratings website where you can sort through all of the results for free. You can even purchase the underlying data if you want to get more access.

The bottom line: Customer experience is improving, but there’s a long way to go