Report: The Four Customer Experience Core Competencies (Free)

If you are only going to read only one thing about customer experience, then this report is it. It’s the blueprint for building a customer-centric organization… and it’s free.

We just published a Temkin Group report, The Four CX Core Competencies. This blueprint to building a customer-centric organization is an update to our groundbreaking research that was originally published in 2010 and updated in 2013.

Temkin Group has conducted multiple large-scale studies demonstrating that customer experience (CX) is highly correlated with loyalty across many different industries, in both business-to-consumer and business-to-business environments. When customers have a good experience with a company, they are more likely to repurchase from the company, try its new offerings, and recommend it to others.

While many companies try to improve their CX by making superficial changes, Temkin Group has found that the only path to lasting differentiation and increased loyalty is to build a customer-centric culture. Temkin Group has studied hundreds of companies to uncover the difference between CX leaders and their less successful peers, and has identified four CX competencies that companies must master if they wish to build and sustain CX differentiation:

  1. Purposeful Leadership: Operate consistently with a clear set of values. (see video)
  2. Compelling Brand Values: Deliver on your brand promises to customers. (see video)
  3. Employee Engagement: Align employees with the goals of the organization. (see video)
  4. Customer Connectedness: Infuse customer insight across the organization. (see video)

Download report for FREE

This whiteboard video describes the Four CX Core Competencies:

Here are the best practices described in the report:

Download report for FREE

Data Snapshot: Media Use Benchmark, 2017

We just published a Temkin Group data snapshot, Media Use Benchmark, 2017. This is our annual analysis of how much time consumers spend using different media channels (see last year’s data snapshot).

Here’s the data snapshot description:

In January 2017, we surveyed 10,000 U.S. consumers about their media usage patterns and compared the results to similar data we collected in January 2016, January 2015, January 2014, January 2013, and January 2012. Our analysis examines the amount of time consumers spend every day watching television, browsing the Internet (for both work and leisure), reading books (both print and electronic), reading newspapers (both print and electronic), listening to the radio, reading a print magazine, and using a mobile phone. This data snapshot breaks down the results by income level, education level, and, most expansively, by age.

Download report for $195
BuyDownload3

Here’s a portion of the first figure from the data snapshot that contains 13 data-rich charts. As you can see:

  • Time spent over the last six years with mobile web/apps has increased the most, followed by using the Internet at work and reading a book online.
  • Across all of the media activities we track except for using the Internet at work, consumers spent more time doing them in 2017 than in 2016.
  • Consumers increased their time reading paper books and magazines by 30% over last year, the largest increase of any activities.
  • While consumers increased their reading of newspapers, they also had a jump of 27% in the amount of time they spent reading the news online.

Download report for $195
BuyDownload3

Report: Lessons in CX Excellence, 2017

1701_lessonsincxexcellence_coverWe just published a Temkin Group report, Lessons in CX Excellence, 2017. The report provides insights from eight finalists in the Temkin Group’s 2016 CX Excellence Awards. The report, which has 62 pages of content, includes an appendix with the finalists’ nomination forms. This report has rich insights about both B2B and B2C customer experience.

Here’s the executive summary:

This year, we named five organizations the winners of Temkin Group’s 2016 Customer Experience Excellence Award – Business Development Bank of Canada (BDC), Century Support Services, Crowe Horwath, Oxford Properties, and VCA. This report highlights specific examples of how these companies’ customer experience (CX) efforts have created value for both their customers and for their businesses, describes winners’ best practices across the four customer experience competencies: purposeful leadership, compelling brand values, employee engagement, and customer connectedness. it includes all of the winners’ detailed nomination forms to help you collect examples and ideas to apply to your own CX efforts.

Download report for $195
BuyDownload3

Here are some highlights from the winners: Read more of this post

Data Snapshot: Channel Preferences Benchmark, 2016

1609_ds_channelpreferences2016_coverWe just published a Temkin Group data snapshot, Channel Preferences and Cross-Channel Activity Benchmark, 2016. The research examines consumer preferences for using different channels for completing common tasks as well as the frequency of several cross-channel interactions.

Here’s the executive summary:

In Q3 2016, we surveyed 10,000 U.S. consumers about their channel preferences for performing 11 different activities—such as selecting a life insurance policy or applying for a new credit card—and compared them to the results of a similar study conducted in 2015. This data snapshot examines how channel preferences vary across age groups, how these preferences have changed over the past year, and how channel preferences differ across multiple activities. (See last year’s data snapshot).

Download report for $195
BuyDownload3

A key component of the research examines how consumers would like to complete 11 different interactions with companies: Apply for a new credit card, change the beneficiary on a life insurance account, check the balance on a savings or checking account, check the delivery status of a purchase you made, investigate a mistake in your monthly cell phone bill, open a new investment account, purchase a new auto insurance policy, resolve a technical problem with your computer, select a life insurance policy,  and update your address on an account after you move.

The report has 13 data-filled charts, covering the 11 activities with details of preferences by age. Here’s one of the graphics (without the numbers) showing that consumers most prefer using their computers…

1609_channelpreferences

Download report for $195
BuyDownload3

Data Snapshot: Social Media Benchmark, 2016

1607_DS_SocialMediaBenchmark2016_COVERTemkin Group just published a data snapshot, Social Media Benchmark, 2016. This annual research effort shows how consumer use of social media sites on both computers and mobile phones are changing. Here’s a description of the data snapshot:

In January 2016, we surveyed 10,000 U.S. consumers about how frequently they use social media on their computers and mobile phones, and we then compared these usage rates to analogous data we collected in January 2012, January 2013, January 2014, & January 2015. This analysis looks at the frequency with which consumers in different age groups use computers and mobile phones to access Facebook, LinkedIn, Twitter, Google+, Pinterest, Tumblr, and third-party rating sites.

Download data snapshot for $195BuyDownload3

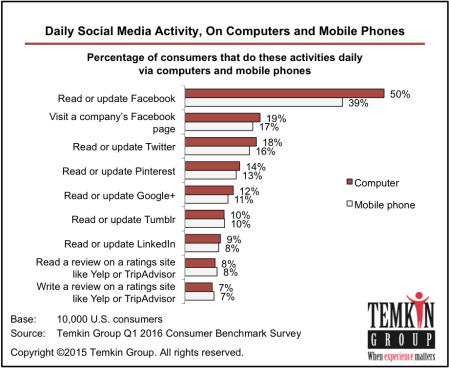
The data snapshot has 13 graphics with data. Here’s a portion of one of the graphics:.

1607_DailySocialMediaComputersMobile

Here are a some additional findings from the research:

  • Daily use of Twitter, Facebook, and Pinterest on computers and mobile phones grew by 2 or more percentage points since last year. Tumblr grew 2 points on mobile phones.
  • All age groups of consumers under 45-years-old less frequently visited company Facebook pages on computers.
  • LinkedIn grew the most with 18- to 24-year-olds on computers, and 45- to 54-year-olds on mobile phones.
  • In most cases, mobile usage is strongest with 18- to 24-year-olds.
  • 18- to 24-year-olds had the largest drop in Facebook use, on both computers and mobile phones.
  • 45- to 54-year-olds had the largest jump in daily Facebook use, on both computers and mobile phones.
  • 25- to 34-year-olds are the largest daily users of almost all social media, on computers and mobile phone.
  • 18- to 24-year-olds are the largest daily users of Tumblr.

Download data snapshot for $195
BuyDownload3

Data Snapshot: Media Use Benchmark, 2016

1603_DS_MediaBenchmark2016_COVERWe just published a Temkin Group data snapshot, Media Use Benchmark, 2016. This is our annual analysis of how much time consumers spend using different media channels (see last year’s data snapshot).

Here’s the data snapshot description:

In January 2016, we surveyed 10,000 U.S. consumers about their media usage patterns and compared the results to similar data we collected in January 2015, January 2014, January 2013, and January 2012. Our analysis examines the amount of time consumers spend every day watching television, browsing the Internet (for both work and leisure), reading books (both print and electronic), reading newspapers (both print and electronic), listening to the radio, reading a print magazine, and using a mobile phone. This data snapshot breaks down the results by income level, education level, and, most expansively, by age.

Download report for $195
BuyDownload3

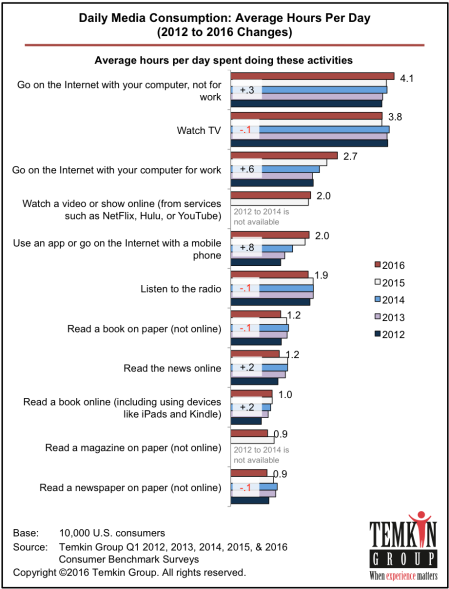
Here’s a portion of the first figure from the data snapshot that contains 12 data-rich charts. As you can see, over the past five years:

  • Time spent with mobile web/apps has increased the most, followed by using the Internet at work and at home.
  • Time spent with TV, radios, books, and newspapers have declined.

1603_MediaChanges

Download report for $195
BuyDownload3

Report: Mobile Experience Review: Purchasing an eGift Card

1603SLICE-B_COVERWe just published a Temkin Group report, Mobile Experience Review: Purchasing an eGift Card. The report uses our SLICE-B experience review methodology to evaluate mobile experiences. We attempt to achieve a specific customer goals and then grade the experience on 12 criteria across six areas: Start, Locate, Interact, Complete, End, and Brand Coherence.

Here’s the executive summary:

As more customers use smartphones, companies need to adjust their websites and processes for the smaller screens. To evaluate the customer experience of mobile websites, we used Temkin Group’s SLICE-B experience review methodology to assess the experience of purchasing an eGift Card from ten large retailers: Macy’s, Kohl’s, Amazon, Barnes & Noble, Petco, Petsmart, Kroger, Safeway, Michaels, and Jo-Ann. Macy’s earned the highest score for its simple yet engaging process, while the user was unable to complete the full purchasing goal at Barnes & Noble, Petco, Petsmart, Kroger, Safeway, and Kohl’s.

Download report for $195
BuyDownload3

Here’s an overview of the results:

1603_MobileSLICEBevals

Download report for $195
BuyDownload3

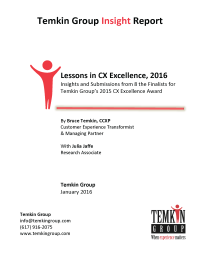
Report: Lessons in CX Excellence, 2016

1601_LessonsInCXExcellence_COVERWe just published a Temkin Group report, Lessons in CX Excellence, 2016. The report provides insights from eight finalists in the Temkin Group’s 2015 CX Excellence Awards. The report, which is 100 pages long, includes an appendix with the finalists’ nomination forms. This report has rich insights about both B2B and B2C customer experience.

Here’s the executive summary:

This year, we chose eight organizations as finalists for Temkin Group’s 2015 Customer Experience Excellence Award. The finalists for 2015 are EMC Global Services, Hagerty, InMoment, Safelite AutoGlass, SunPower, The Results Companies, Verint, and Wheaton | Bekins. This report provides specific examples describing how these companies’ CX efforts have created value for both their customers and for their businesses. We also highlight best practices across the four customer experience competencies—purposeful leadership, compelling brand values, employee engagement, and customer connectedness. We have included all of the finalists’ detailed nomination forms at the end of this report to help you compile examples and ideas to apply to your own CX efforts.

Download report for $195
BuyDownload3

Here are some highlights from the finalists: Read more of this post