Report: Employee Engagement Competency & Maturity, 2017

1706_StateOfEE2017_COVER2We just published a Temkin Group report, Employee Engagement Competency & Maturity, 2017. Here’s the executive summary of this annual review of employee engagement activities, competencies, and maturity levels for large companies:

Engaged employees are critical assets to their organization. It’s not surprising, therefore, that customer experience leaders have more engaged employees than their peers. To understand how companies are engaging their employees, we surveyed 169 large companies and compared their responses with similar studies we’ve conducted in previous years. We also asked survey respondents to complete Temkin Group’s Employee Engagement Competency & Maturity (EECM) Assessment. Highlights from our analysis of their responses include:

  • Front-line employees are viewed as the most highly engaged.
  • More than 70% of companies measure employee engagement at least annually, yet only 45% of executives consider taking action on the results a high priority.
  • Sixty-four percent of respondents believe that their social media tools have had a positive impact on their employee engagement activities, an increase from last year.
  • The top obstacle to employee engagement activities continues to be the lack of an employee engagement strategy.
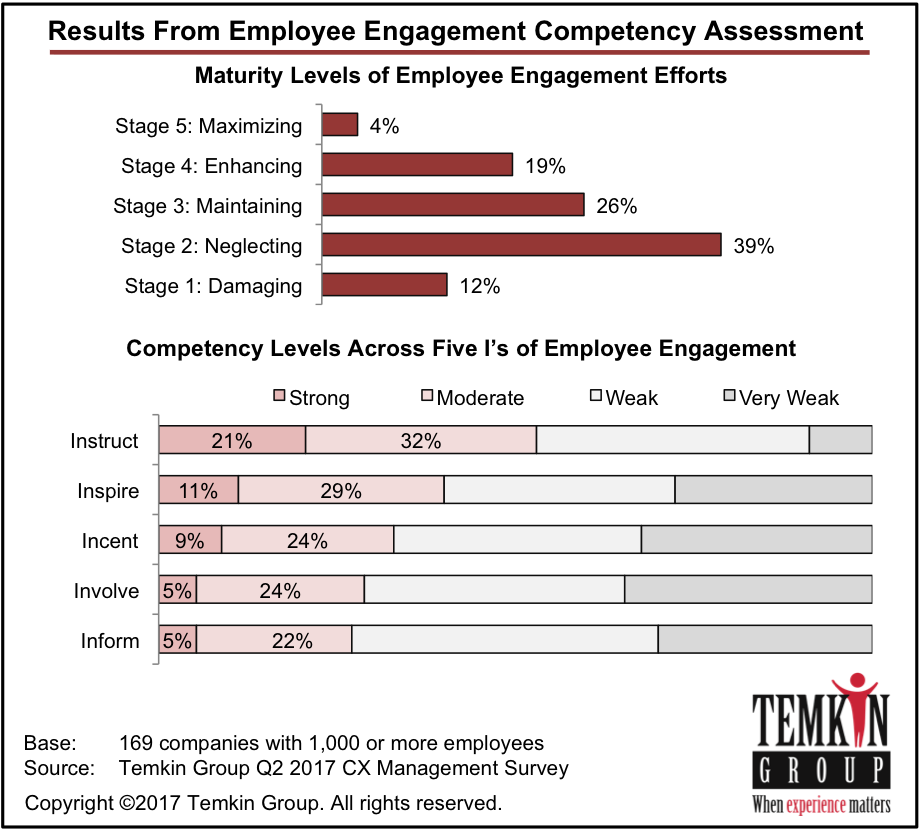
  • While only 23% of companies are in the top two stages of employee engagement maturity, this is still an increase from last year.
  • When we compared companies with above average employee engagement maturity to those with lower maturity, we found that employee engagement leaders have better customer experience, enjoy better financial results, are more likely to take action on employee feedback, and face fewer obstacles than their counterparts with less engaged workforces.
  • You can use the results of the EECM Assessment to benchmark your own employee engagement activities.

Download report for $195+
BuyDownload3

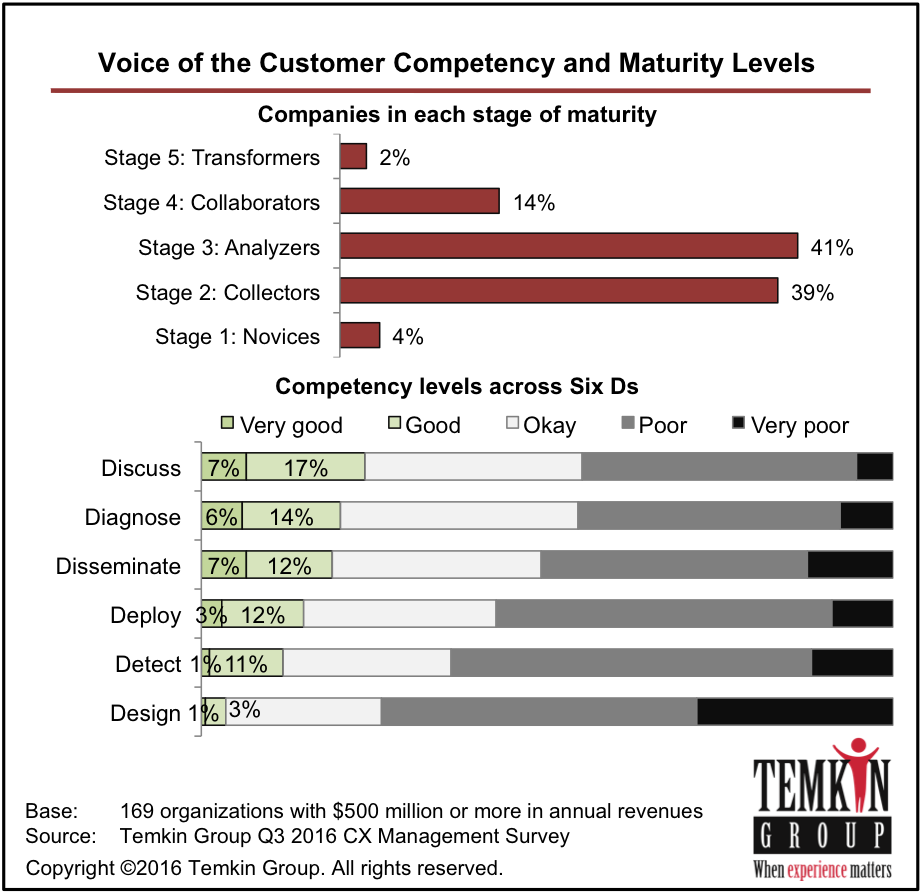
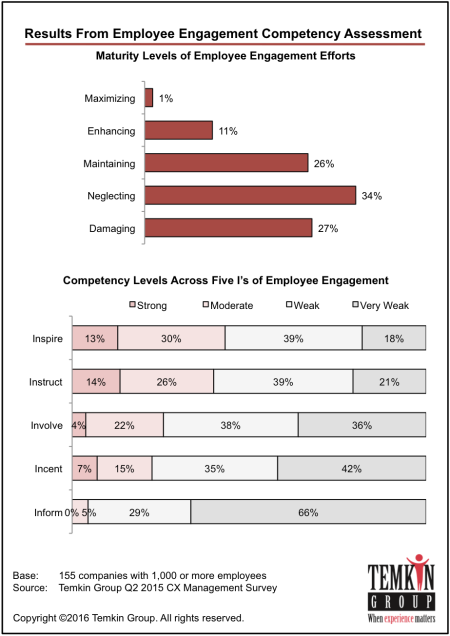
Here’s an excerpt from one of the 17 graphics that shows the maturity levels of employee engagement efforts in large companies and their effectiveness across five employee engagement competencies:
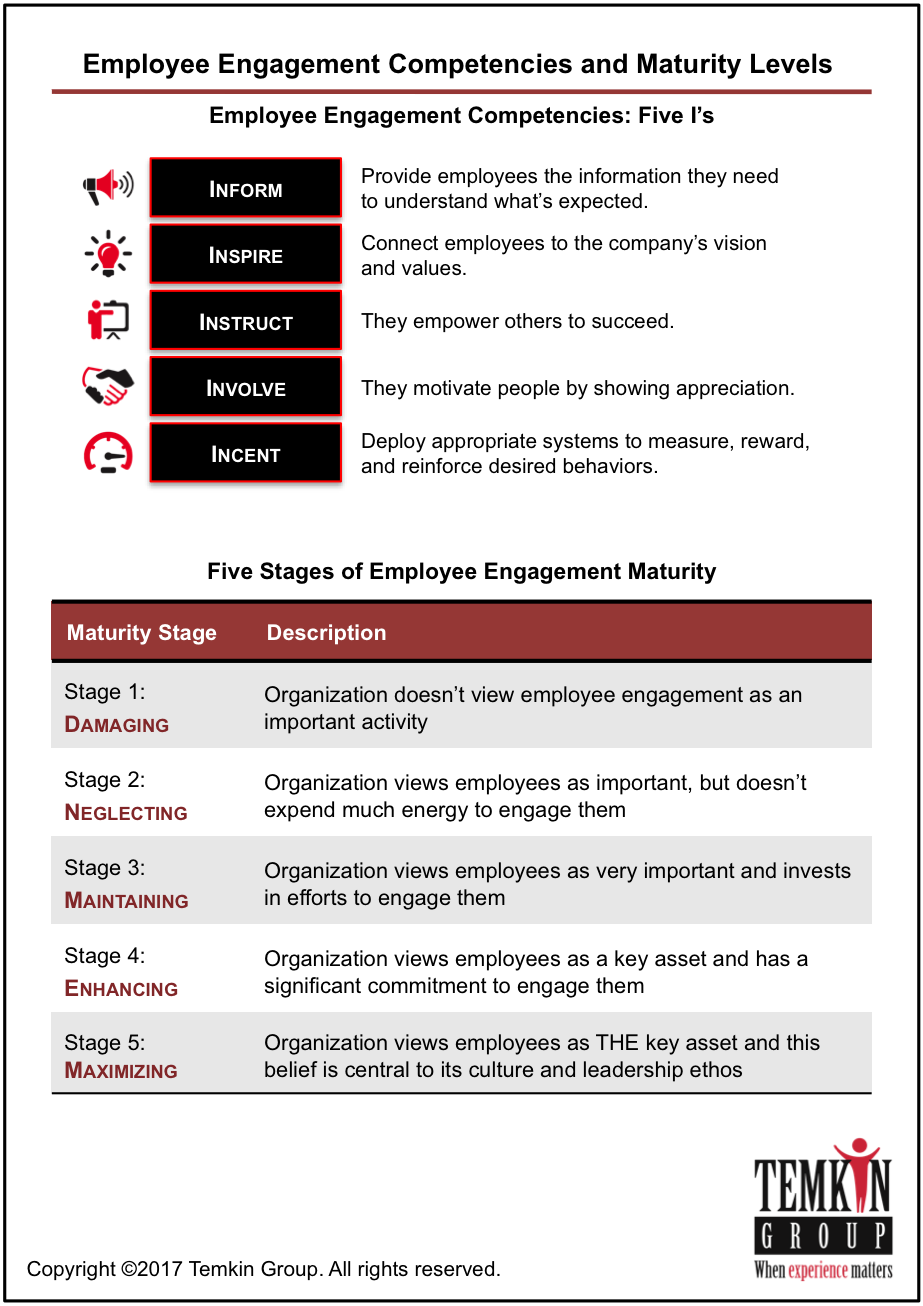
Download report for $195+BuyDownload3

Report: 2017 Temkin Experience Ratings, UK

We just published a Temkin Group report, 2017 Temkin Experience Ratings, UK. This is the same customer experience benchmark that we’ve been publishing for U.S. firms over the past seven years.

The UK Temkin Experience Ratings is a cross-industry, open-standard benchmark of customer experience. To generate these scores, we asked 5,000 UK consumers to rate their recent interactions with 157 companies across 16 industries and then evaluated their experiences across three dimensions: success, effort, and emotion.

Here are some highlights from the research:

  • Co-op, M&S Food, and Lidl earned highest overall ratings, while Audi, BMW, and Flybe earned the lowest.
  • When we compared company ratings with their industry averages, we found that Saga, Premier Inn, Vauxhall, and Volkswagen most outperformed their peers, while Audi and Bank of Scotland fell well below their competitors.
  • Take a look at a listing of all 157 companies.

Download report and dataset for $295
(Report includes an Excel file with data for all 157 companies.
Download sample dataset to see what’s included)
BuyDownload3

Here are the top and bottom companies and the industry averages in the 2017 Temkin Experience Ratings, UK:

Download report and dataset for $295
(Report includes an Excel file with data for all 157 companies.
Download sample dataset to see what’s included)
BuyDownload3

Report: Employee Engagement Benchmark Study, 2017

We just published a Temkin Group report, Employee Engagement Benchmark Study, 2017. This is the sixth year that we’ve published the benchmark of U.S. employees. The research is based on an online survey on Q3 2016. (Take a look at our Employee Engagement Resource Page).

For the sixth year in a row, Temkin Group used the Temkin Employee Engagement Index to analyze the engagement levels of more than 5,000 U.S. employees. We found that:

  • Sixty-three percent of U.S. employees are “highly” or “moderately” engaged – the highest level we’ve seen in the six years we’ve conducted this study.
  • Companies that outperform their competitors in both financial results and customer experience have more engaged workers.
  • Compared to disengaged employees, highly engaged employees are almost five times more likely to recommend the company’s products and services, they are over four times more likely to do something that is good, yet unexpected, for the company, they are three times more likely to stay late at work if something need to be done, and they are over five times more likely to recommend an improvement at the company.
  • Companies with 501 to 1,000 employees have the highest percentage of engaged employees, while companies with 10,000 or more employees have the lowest.
  • On an individual level, our research shows that the most highly engaged employees tend to be those who regularly interact with customers, who are highly educated, who earn a high income, and who are executives.
  • Forty-nine percent of construction employees are highly engaged, the highest level of any industry. At the other end of the spectrum, only 20% of employees in public administration are highly engaged.
  • Given the significant value of engaged employees, we recommend that companies improve engagement levels by mastering our Five I’s of Employee Engagement: Inform, Inspire, Instruct, Involve, and Incent.

Download report for $195
BuyDownload3

Here’s what we found when we examined year-over-year results for the Temkin Employee Engagement Index:

Download report for $195
BuyDownload3

Here are previous employee engagement benchmark studies: 2016, 2015, 2014, 2013, 2012.

Data Snapshot: Media Use Benchmark, 2017

We just published a Temkin Group data snapshot, Media Use Benchmark, 2017. This is our annual analysis of how much time consumers spend using different media channels (see last year’s data snapshot).

Here’s the data snapshot description:

In January 2017, we surveyed 10,000 U.S. consumers about their media usage patterns and compared the results to similar data we collected in January 2016, January 2015, January 2014, January 2013, and January 2012. Our analysis examines the amount of time consumers spend every day watching television, browsing the Internet (for both work and leisure), reading books (both print and electronic), reading newspapers (both print and electronic), listening to the radio, reading a print magazine, and using a mobile phone. This data snapshot breaks down the results by income level, education level, and, most expansively, by age.

Download report for $195
BuyDownload3

Here’s a portion of the first figure from the data snapshot that contains 13 data-rich charts. As you can see:

  • Time spent over the last six years with mobile web/apps has increased the most, followed by using the Internet at work and reading a book online.
  • Across all of the media activities we track except for using the Internet at work, consumers spent more time doing them in 2017 than in 2016.
  • Consumers increased their time reading paper books and magazines by 30% over last year, the largest increase of any activities.
  • While consumers increased their reading of newspapers, they also had a jump of 27% in the amount of time they spent reading the news online.

Download report for $195
BuyDownload3

Report: State of the CX Profession, 2017

1702_stateofcx-profession2017_coverWe just published a Temkin Group report, State of the CX Profession, 2017. This is the fifth year that we’ve examined the roles of CX professionals and the third year that we’ve done a compensation study. Here’s the executive summary:

To understand the mindset and roles of customer experience professionals today, we surveyed 237 CX professionals and then compared their responses to similar studies we’ve conducted over the previous five years. We asked them how their CX efforts impacted their organization last year and about their plans for the coming year. This report also includes a compensation study, which is based on the 158 respondents who agreed to participate. Here are some highlights from the research:

  • Eighty-four percent of respondents say that their customer experience efforts have had a positive business impact in 2016.
  • Ninety-nine percent think that customer experience is a great profession to be in, the highest level we’ve seen in the six years we’ve been doing the study.
  • Eighty percent think that customer experience will be more important for their companies in 2017 than it was in 2016, compared to the 3% who think it will be less important.
  • Forty-nine percent expect to see an increase in their customer experience staffing levels this year – a higher percentage than we’ve seen in previous years.
  • Respondents plan to increase their spending most on voice of the customer software and text analytics.
  • Respondents plan to increase their focus most on Web experiences and customer insights and analysis.
  • The total amount of compensation in our study ranges from $93,000 for mid-level individual contributors to $239,000 for CX executives.

1602_DontBuyReportJoinCXPA

Download report for $195
BuyDownload3

Here’s some data that combines pieces of two graphic, showing that CX continues to be a great profession….

1702_cxprofessionalssummary

Download report for $195
BuyDownload3

The bottom line: The CX profession is thriving.

Data Snapshot: CX Expectations and Plans for 2017

1702_ds_cxplansfor2017_coverTemkin Group just published a data snapshot, Customer Experience Expectations and Plans for 2017. This annual research effort shows an increase in focus, effort, and spending on customer experience in 2017. Here’s a description of the data snapshot:

In December 2016, Temkin Group surveyed 165 respondents – each from a company with $500 million or more in annual revenues – about their customer experience efforts over the past year and their plans for 2017 and beyond. We compared the results of this survey to the results of similar surveys we’ve conducted over the previous six years. This year’s results show that companies plan on dedicating more money and effort to improving a variety of customer experience activities.

Download data snapshot for $195BuyDownload3

The data snapshot has 12 graphics with data about CX plans and expectations for 2017. Here’s an excerpt from two of the graphics:

1702_cximpactandimportance

Here are some highlights from the research:

  • The percentage of respondents who report at least moderately positive results from their previous year’s CX efforts grew from 44% in Q4 2015 to 52% in Q4 2016.
  • Sixty-four percent of companies that report at least moderately positive results from their 2016 CX efforts had better financial performance than their peers, compared with only 44% of other firms.
  • The percentage of respondents who looked ahead and said that CX will be significantly more important in the following year grew from 40% in Q4 2015 to 45% in Q4 2016.
  • The percentage of respondents who expect CX spending to increase in the following year grew from 57% in Q4 2015 to 67% in Q4 2016.
  • The percentage of respondents who expect to increase their full-time CX staff in the following year grew from 37% in Q4 2015 to 44% in Q4 2016 (only 5% expect to cut back their staffing this year).
  • Spending growth is expected to be strongest for VoC software, predictive analytics, and experience design agencies.
  • Web and mobile will remain the most important channels of focus in 2017, while social media experiences decline in importance.
  • Customer insights and analytics remains the most important CX activity.
  • Companies are planning to increase their use of CX metrics to drive compensation across all types of employees.
  • More than half of respondents expect to increase CX training with customer-facing employees.

Download data snapshot for $195
BuyDownload3

Report: Engaging A Tethered Workforce

1701_engagingatetheredworkforce_coverWe just published a Temkin Group report, Engaging A Tethered Workforce.  Here’s the executive summary:

Companies across a number of industries create and deliver customer experiences (CX) through a combination of traditional employees and other workers who they do not directly control – such as contractors or employees of channel partners or outsourcing partners. Despite not being directly employed by the company, these other workers – who make up what Temkin Group calls a “tethered workforce” – still play a critical role in delivering experiences that represent the company’s brand. However, tethered workers differ from typical full-time, corporate employees in ways that pose challenges to brands’ efforts to align these workers with their customer experience goals and objectives. In this report, we examine how brands are tapping into these tethered employees. Here are some highlights:

  • Companies must manage three connections: 1) Between themselves and their partners that employ the tethered workers, 2) Between their partners and the tethered employees, and 3) Between themselves and the tethered workers.
  • We share over 30 examples of best practices from across Temkin Group’s Five I’s of Employee Engagement: Inform, Inspire, Instruct, Involve, and Incent.
  • We offer brands a blueprint for engaging tethered workers with key things to think about across the three connections of tethered workforces.

Download report for $195BuyDownload3

Here are the 17 best practices described in the report:

1701_bestpracticesforengagingtetheredworkers

Download report for $195
BuyDownload3

2017 Customer Experience Trends (Video and Infographic)

We recently published our annual listing of CX trends. In case that wasn’t enough to satiate your needs, here’s a recorded webinar and an infographic describing the trends…


2017cxtrends_infographic

Click on figure above to download infographic as a .png file, or click here to download it as a .pdf.

Report: The State of CX Metrics, 2016

1612_stateofcxmetrics2016_coverWe published a Temkin Group report, The State of CX Metrics, 2016. This is the sixth year of this study that examines the CX metrics efforts within large companies. Here’s the executive summary:

Temkin Group surveyed 183 companies to learn about how they use customer experience (CX) metrics and then compared their answers with similar studies we’ve conducted every year since 2011. We found that the most commonly used metrics continue to be likelihood-to-recommend and satisfaction, while the most successful metric is transactional interaction satisfaction. Only 10% of companies regularly consider the effect of CX metrics when they make day-to-day decisions. The top two problems companies face are limited visibility of CX metrics and the lack of taking action on metrics. Companies are best at measuring customer service and phone-based experiences and are worst at measuring the experiences of prospects and customers who defect. We also had companies complete Temkin Group’s CX Metrics Program Assessment, which examines four characteristics of a metrics program: consistent (does the company use common CX metrics across the organization?), impactful (do the CX metrics inform important decisions?), integrated (are trade-offs made between CX and financial metrics?), and continuous (do leaders regularly examine the CX metrics?). Only 11% of respondents received at least a “good” overall rating in this assessment, and companies earned the lowest average rating in integrated. Companies with stronger CX metrics programs deliver better customer experience and use more effort and likelihood-to-repurchase metrics.

See the State of CX Metrics studies from 2011, 201220132014, and 2015.

Download report for $195
BuyDownload3

Here are the results form our CX Metrics Competency & Maturity Assessment (one of 22 graphics in the report):

1612_cxmetricsmaturity

Download report for $195
BuyDownload3

Report: State of Voice of the Customer Programs, 2016

1610_stateofvocprograms2016_coverWe published a Temkin Group report, State of Voice of the Customer Programs, 2016. This is the sixth year that we’ve benchmarked the competency & maturity of voice of the customer programs within large organization. Here’s the executive summary:

For the sixth straight year, Temkin Group has benchmarked the competency and maturity levels of voice of the customer (VoC) programs within large organizations. We found that while most companies think that their VoC efforts are successful, less than one-third of companies actually consider themselves good at reviewing implications that cut across the organization. Respondents think that in the future, the most important source of insights will be customer interaction history and the least important source will be multiple-choice questions. And although respondents believe that technology will play an increasingly important role in their VoC efforts, they also cite “integration across systems” as the biggest obstacle to their VoC success, and this concern has only grown in the past year. In addition to asking questions about their VoC program, we also had respondents complete Temkin Group’s VoC Competency and Maturity Assessment, which examines capabilities across what we call the “Six Ds”: Detect, Disseminate, Diagnose, Discuss, Design, and Deploy. Only 16% of companies have reached the two highest levels of VoC maturity, while 43% remain in the bottom two levels. When we compared higher-scoring VoC programs with lower-scoring programs, we found that companies with mature programs are more successful, they focus more on analytics, and they have more full-time staff, more strongly coordinated efforts, and more involved senior executives.

See the State of VoC reports from 2010201120132014, and 2015.

Download report for $195
BuyDownload3

Here are the results from Temkin Group’s VoC Competency & Maturity Assessment:

1610_vocmaturity

Download report for $195
BuyDownload3

Data Snapshot: Social Media Benchmark, 2016

1607_DS_SocialMediaBenchmark2016_COVERTemkin Group just published a data snapshot, Social Media Benchmark, 2016. This annual research effort shows how consumer use of social media sites on both computers and mobile phones are changing. Here’s a description of the data snapshot:

In January 2016, we surveyed 10,000 U.S. consumers about how frequently they use social media on their computers and mobile phones, and we then compared these usage rates to analogous data we collected in January 2012, January 2013, January 2014, & January 2015. This analysis looks at the frequency with which consumers in different age groups use computers and mobile phones to access Facebook, LinkedIn, Twitter, Google+, Pinterest, Tumblr, and third-party rating sites.

Download data snapshot for $195BuyDownload3

The data snapshot has 13 graphics with data. Here’s a portion of one of the graphics:.

1607_DailySocialMediaComputersMobile

Here are a some additional findings from the research:

  • Daily use of Twitter, Facebook, and Pinterest on computers and mobile phones grew by 2 or more percentage points since last year. Tumblr grew 2 points on mobile phones.
  • All age groups of consumers under 45-years-old less frequently visited company Facebook pages on computers.
  • LinkedIn grew the most with 18- to 24-year-olds on computers, and 45- to 54-year-olds on mobile phones.
  • In most cases, mobile usage is strongest with 18- to 24-year-olds.
  • 18- to 24-year-olds had the largest drop in Facebook use, on both computers and mobile phones.
  • 45- to 54-year-olds had the largest jump in daily Facebook use, on both computers and mobile phones.
  • 25- to 34-year-olds are the largest daily users of almost all social media, on computers and mobile phone.
  • 18- to 24-year-olds are the largest daily users of Tumblr.

Download data snapshot for $195
BuyDownload3

Report: State of Employee Engagement Maturity, 2016

1607_StateOfEE2016_COVERWe just published a Temkin Group report, State of Employee Engagement Maturity, 2016. Here’s the executive summary of this annual review of employee engagement activities, competencies, and maturity levels for large companies:

Engaged employees are critical assets for any customer experience effort. As engaged employees are critical assets, it’s not surprising our data shows that customer experience leaders have more engaged employees than their peers. To understand what companies are doing to engage their employees, we surveyed more than 150 large companies and compared their responses with similar studies we’ve conducted in previous years. We found that two-thirds of companies survey their employees at least once a year, but that less than half of executives consider it a high priority to act on the results of that survey. We used Temkin Group’s Employee Engagement Competency & Maturity (EECM) Assessment to gauge the maturity levels and efforts of these companies across our five competencies, called the “Five I’s of Employee Engagement:” Inform, Inspire, Instruct, Involve, and Incent. We found that only 12% of companies have reached the top two levels of maturity, Enhancing and Maximizing, which is a drop from 2015. The lack of a clear employee engagement strategy remains the number one obstacle that companies face. We also compared companies with above average employee engagement maturity to those with lower maturity and found that employee engagement leaders enjoy better financial results than their counterparts with less engaged workforces.

Download report for $195
BuyDownload3

Here’s one of the 17 graphics:

1607_EECompetenciesMaturity

Here’s a link to the 2015 study.

Download report for $195
BuyDownload3

The bottom line: Companies should invest more in employee engagement.

Report: The State of CX Management, 2016

1605_StateOfCXMgt16_COVERWe just published a Temkin Group report, The State of CX Management, 2016. This is the seventh annual benchmark of CX activities, competencies, and maturity levels.  Here’s the executive summary:

For the seventh straight year, Temkin Group surveyed large companies to evaluate the state of their Customer Experience (CX) management. This year we found an abundance of CX ambition and activity. Most companies have a CX executive leading the charge, a central team coordinating significant CX activities, and a staff of six to 10 full-time CX professionals. Temkin Group has identified four CX core competencies that companies must master if they want to become customer-centric: Purposeful Leadership, Compelling Brand Values, Employee Engagement, and Customer Connectedness. Using Temkin Group’s CX competency and maturity assessment, we found that only 10% of companies have reached the highest two levels of customer experience, and companies are weakest in the Compelling Brand Values competency. We additionally compared CX laggards with CX leaders and discovered that the leaders have stronger financial results, have more senior executives leading the company-wide CX efforts, have more full-time CX employees, use more analytics, and have more support from senior leaders. This report also includes an assessment that companies can use to benchmark their CX efforts and capabilities.

Download report for $195
BuyDownload3

Temkin Group’s Customer Experience Maturity Model uses six stages of CX maturity based on the four customer experience core competencies. Here’s what we found when 210 companies completed the assessment:

1606_CXMaturity

Download report for $195
BuyDownload3

Report: What Happens After a Good or Bad Experience, 2016

1603_WhatHappensAfterGoodBadExperiences_COVERWe just published a Temkin Group report, What Happens After a Good or Bad Experience, 2016. This is our annual analysis of which companies deliver the most and least bad experiences, how consumers respond after those experience (in terms of sharing those experiences and changing their purchase behaviors), and the effect of service recovery (see last year’s report).

Here’s the executive summary:

We asked 10,000 U.S. consumers about their recent interactions with 315 companies across 20 industries, and compared results with similar studies over the previous five years. More than 20% of the customers of Internet service providers and TV service providers reported a bad experience, considerably above the rates for any other industry. Air Tran Airways, Time Warner Cable (TV service and Internet service), Comcast (TV service), and HSBC delivered bad experience to at least one-quarter of their customers. At the same time, less than 3% of Michael’s, Advance Auto Parts, Whole Foods, Publix, Subway, Vanguard, Trader Joe’s, and GameStop customers report having bad experiences. We examined the combination of the volume of bad experiences and the resulting revenue impact and created a Revenues at Risk Index for all 20 industries. At the top of the list, TV service providers and rental car agencies stand to lose at least 6.5% of their revenue from bad experiences. Conversely, less than 2% of the revenues for retailers and supermarket chains are at risk. The companies that recovered very poorly after a bad experience lost sales from 63% of their customers, more than 2.5 times as many as companies that recovered very well. Companies that do a very good job at recovering after a bad experience have more customers who increase spending than those who decrease spending. After a very bad or very good experience, consumers are more likely to give feedback directly to the company than they are to post on Facebook, Twitter, or third party rating sites. Regardless of the channel, consumers are more likely to discuss a very bad experience than a very good one. While the way that consumers give feedback has not changed much since last year, the volume of Twitter usage grew for both positive and negative experiences. Piggly Wiggly, US Cellular, Fifth Third, The Hartford, TriCare, and PSE&G face the potential for the most negatively biased feedback from customers.

Download report for $195
BuyDownload3

Here are excerpted versions of 4 (out of 15) graphics in the report: Read more of this post

Data Snapshot: Media Use Benchmark, 2016

1603_DS_MediaBenchmark2016_COVERWe just published a Temkin Group data snapshot, Media Use Benchmark, 2016. This is our annual analysis of how much time consumers spend using different media channels (see last year’s data snapshot).

Here’s the data snapshot description:

In January 2016, we surveyed 10,000 U.S. consumers about their media usage patterns and compared the results to similar data we collected in January 2015, January 2014, January 2013, and January 2012. Our analysis examines the amount of time consumers spend every day watching television, browsing the Internet (for both work and leisure), reading books (both print and electronic), reading newspapers (both print and electronic), listening to the radio, reading a print magazine, and using a mobile phone. This data snapshot breaks down the results by income level, education level, and, most expansively, by age.

Download report for $195
BuyDownload3

Here’s a portion of the first figure from the data snapshot that contains 12 data-rich charts. As you can see, over the past five years:

  • Time spent with mobile web/apps has increased the most, followed by using the Internet at work and at home.
  • Time spent with TV, radios, books, and newspapers have declined.

1603_MediaChanges

Download report for $195
BuyDownload3