CX Competency: Customer Connectedness (Video)

Temkin Group has found that the only path to sustainable customer experience differentiation is to build a customer-centric culture. How? By mastering Four Customer Experience Core Competencies.

This video provides an overview of one of those competencies, Customer Connectedness, where the goal is to infuse customer insight across the organization.

Here Are Four Strategies For Customer Connectedness:

Report: The Shift To Customer Journey Insights

We just published a Temkin Group report, The Shift To Customer Journey Insights. Here’s the executive summary:

Customer insights are critical to customer experience programs. However, current insights’ efforts tend to focus on individual interactions rather than on a customer’s entire journey, and as a result, they often fail to provide a complete picture of a customer’s experience with the company. This report helps companies shift their insights efforts from concentrating narrowly on single transactions to focusing broadly on customers’ journeys.

Here are some highlights :

  • We developed an approach to help companies create a comprehensive view of journeys called Customer Journey Insights (CJI), which is made up of five strategies: Internal Journey Alignment, Journey Data Farming, Journey Performance Tracking, Journey Visualization, and Journey Prioritization.
  • We share 20 examples of best practices from companies that are applying these strategies to develop a more complete understanding of their customers’ journeys.
  • To help companies master these strategies, we have identified three stages organizations proceed through on their path to enabling customer journeys: 1) Customer Journey Orientation, 2) Customer Journey Enablement, and 3) Customer Journey Mastery.

Download report for $195
BuyDownload3

Here are the best practices focused around five strategies for shifting towards customer journey insights:

  1. Internal Journey Alignment. Shift the company’s mindset away from siloed interaction success to customer goal facilitation.
  2. Journey Data Farming. Tap into adjacent data sources and make linkages across channels.
  3. Journey Performance Tracking. Overhaul metrics to measure performance across customer journeys.
  4. Journey Visualization. Create mechanisms for communicating insights in a way that reinforces the centrality of customer journeys.
  5. Journey Prioritization. Focus on the journeys, customer segments, and channels that are strategic business priorities.

Download report for $195
BuyDownload3

Report: What Happens After a Good or Bad Experience, 2017

We just published a Temkin Group report, What Happens After a Good or Bad Experience, 2017. This is our annual analysis of which companies deliver the most and least bad experiences, how consumers respond after those experience (in terms of sharing those experiences and changing their purchase behaviors), and the effect of service recovery (see last year’s report).

Here’s the executive summary:

To understand how good and bad experiences effect customer behavior, we asked 10,000 U.S. consumers about their recent interactions with more than 300 companies across 20 industries. We then compared results with similar studies we’ve conducted over the previous six years. Here are some highlights:

  • About 19% of the customers who interacted with Internet service providers and TV service providers reported having a bad experience – a considerably higher percentage than in other industries. Of the companies we evaluated, 21st Century, Spirit Airlines, and HSBC deliver bad experiences most frequently.
  • We looked at the percentage of customers in an industry had a bad experience and combined that number with the percentage of customers who said they decreased their spending after a bad experience and then used this data to create a Revenues at Risk Index for all 20 industries. Rental car agencies stand to lose the most revenue (6.7%) from delivering bad experiences, while retailers stand to lose the least (1%).
  • Investment firms are most effective at recovering after a bad experience, whereas TV service providers are the least effective.
  • After customers have a very bad or very good experience with a company, they are more likely to give feedback directly to the company than they are to post about it on Facebook, Twitter, or third party rating sites. Customers are also more likely to share positive feedback through online surveys and share negative feedback through emails.
  • Compared to previous years, customers are more likely to share feedback over Facebook and Twitter, and these channels are most popular with consumers who are between 25- and 44-years-old.
  • Of all the companies we evaluated, The Hartford is the most likely to receive negatively biased feedback directly from its customers, while Chubb is likely to receive the most positively biased feedback.

Download report for $195
BuyDownload3

Here are excerpted versions of 3 (out of 19) graphics in the report:
Read more of this post

Data Snapshot: Media Use Benchmark, 2017

We just published a Temkin Group data snapshot, Media Use Benchmark, 2017. This is our annual analysis of how much time consumers spend using different media channels (see last year’s data snapshot).

Here’s the data snapshot description:

In January 2017, we surveyed 10,000 U.S. consumers about their media usage patterns and compared the results to similar data we collected in January 2016, January 2015, January 2014, January 2013, and January 2012. Our analysis examines the amount of time consumers spend every day watching television, browsing the Internet (for both work and leisure), reading books (both print and electronic), reading newspapers (both print and electronic), listening to the radio, reading a print magazine, and using a mobile phone. This data snapshot breaks down the results by income level, education level, and, most expansively, by age.

Download report for $195
BuyDownload3

Here’s a portion of the first figure from the data snapshot that contains 13 data-rich charts. As you can see:

  • Time spent over the last six years with mobile web/apps has increased the most, followed by using the Internet at work and reading a book online.
  • Across all of the media activities we track except for using the Internet at work, consumers spent more time doing them in 2017 than in 2016.
  • Consumers increased their time reading paper books and magazines by 30% over last year, the largest increase of any activities.
  • While consumers increased their reading of newspapers, they also had a jump of 27% in the amount of time they spent reading the news online.

Download report for $195
BuyDownload3

Report: Lessons in CX Excellence, 2017

1701_lessonsincxexcellence_coverWe just published a Temkin Group report, Lessons in CX Excellence, 2017. The report provides insights from eight finalists in the Temkin Group’s 2016 CX Excellence Awards. The report, which has 62 pages of content, includes an appendix with the finalists’ nomination forms. This report has rich insights about both B2B and B2C customer experience.

Here’s the executive summary:

This year, we named five organizations the winners of Temkin Group’s 2016 Customer Experience Excellence Award – Business Development Bank of Canada (BDC), Century Support Services, Crowe Horwath, Oxford Properties, and VCA. This report highlights specific examples of how these companies’ customer experience (CX) efforts have created value for both their customers and for their businesses, describes winners’ best practices across the four customer experience competencies: purposeful leadership, compelling brand values, employee engagement, and customer connectedness. it includes all of the winners’ detailed nomination forms to help you collect examples and ideas to apply to your own CX efforts.

Download report for $195
BuyDownload3

Here are some highlights from the winners: Read more of this post

State of Voice of the Customer (Infographic)

Voice of the Customer (VoC) programs are a central part of most customer experience efforts. Here’s some interesting data snippets from the recent report, State of VoC Programs, 2016.

For additional info, check out our VoC resource page.

voc-infographic-01

You can download (and print) this infographic in different forms:

Report: The State of CX Metrics, 2016

1612_stateofcxmetrics2016_coverWe published a Temkin Group report, The State of CX Metrics, 2016. This is the sixth year of this study that examines the CX metrics efforts within large companies. Here’s the executive summary:

Temkin Group surveyed 183 companies to learn about how they use customer experience (CX) metrics and then compared their answers with similar studies we’ve conducted every year since 2011. We found that the most commonly used metrics continue to be likelihood-to-recommend and satisfaction, while the most successful metric is transactional interaction satisfaction. Only 10% of companies regularly consider the effect of CX metrics when they make day-to-day decisions. The top two problems companies face are limited visibility of CX metrics and the lack of taking action on metrics. Companies are best at measuring customer service and phone-based experiences and are worst at measuring the experiences of prospects and customers who defect. We also had companies complete Temkin Group’s CX Metrics Program Assessment, which examines four characteristics of a metrics program: consistent (does the company use common CX metrics across the organization?), impactful (do the CX metrics inform important decisions?), integrated (are trade-offs made between CX and financial metrics?), and continuous (do leaders regularly examine the CX metrics?). Only 11% of respondents received at least a “good” overall rating in this assessment, and companies earned the lowest average rating in integrated. Companies with stronger CX metrics programs deliver better customer experience and use more effort and likelihood-to-repurchase metrics.

See the State of CX Metrics studies from 2011, 201220132014, and 2015.

Download report for $195
BuyDownload3

Here are the results form our CX Metrics Competency & Maturity Assessment (one of 22 graphics in the report):

1612_cxmetricsmaturity

Download report for $195
BuyDownload3

Report: Capturing Insights from Online Customer Communities

1612_communityinsights_coverWe published a Temkin Group report, Capturing Insights from Online Customer Communities. Here’s the executive summary:

Companies across a range of industries use online customer communities to augment their customer support, marketing, and product innovation efforts. However, when used thoughtfully, these online communities can provide value far beyond their original purpose. Because these communities signify an ongoing relationship between the company and participating customers, customer insights teams will find that these forums contain a treasure trove of insights. As a result of these deeper relationships, online communities offer unique advantages to voice of the customer (VoC) programs, including Always-on Feedback, Broad and Diverse Insights, Continuous Dialogue, Peer-to-Peer Dynamics, and Employee-to-Community Interactivity. These unique advantages can help companies adapt to the five Customer Insight Trends that are changing the face of VoC programs: 1) Deep empathy, not stacks of metrics, 2) Continuous insights, not periodic studies, 3) Customer journeys, not isolated interactions, 4) Useful prescriptions, not past descriptions, and 5) Enterprise intelligence, not customer feedback. To help organizations get the most value from their communities, Temkin Group has highlighted best practices for capturing and using insights from customer communities across these five trends. Companies also must plan for the entire community lifecycle to be successful; this includes Determine Strategy, Structure Community, Recruit Members, Grow and Maintain, and Close Down.

Download report for $195
BuyDownload3

Online customer communities have some unique attributes that make them a valuable component to voice of the customer programs (one of the 12 figures in the report):

1612_attributesofonlinecommmunities

Download report for $195
BuyDownload3

5 Market Research Lessons From Election Polling Miscues

161111_tornmarketresearchIn the NY Times article Pollsters Face Hurdles in Changing Landscape and Aaron Zitner discuss a number of reasons for recent high-profile polling failures, the Brexit vote and the U.S. presidential election.

Why should customer experience (CX) professionals care? Here’s what they say in the article:

The outcome also raises questions about the research businesses rely on to test new products and measure customer behaviors, since many of the same survey methods are used for market research.

The article brings up some good reasons for the poor predictions:

  • People are less likely to answer surveys, so it’s harder to get representative samples.
  • It’s more difficult and expensive to reach people via cell phones than it was by landline.
  • Decision factors are changing. For instance, education level was a more important decision driver in this election than it was in 2012.
  • The people who choose to respond to polls don’t fully represent the population.

My take: I’ve been talking about the need to shake-up market research for many years. As a matter of fact, my 2011 post Market Research Needs An Overhaul remains relevant today. All of the issues with recent polling projections are similar to what many companies face when trying to understand their customers. Here are five thoughts on how to prepare your market research efforts for the new realities:

  1. Embrace outliers. The traditional approach for dealing with data points that don’t fit a model is to ignore them or discount them as being “outliers.” But these counter-trend pieces of data can be much more than that. They may be a window into an emerging trend or a small signal about a set of customers that your current research is missing. When you see an outlying datapoint, don’t ignore it anymore. Think about what it might be telling you, and what insights you may missing.
  2. Always ask “who are we missing?” All research processes, including surveys, are biased in many different ways (see my Latest 9 Recommendations for NPS). You can minimize and address some of the biases, but there’s always the risk that you just don’t see some of them. One of the things you can do is to proactively look for the biases. Always seek to define the populations of people that you are missing or under-representing in your research, whether it’s caused by a demographic or attitudinal blind spot. If you can’t find them, then you haven’t looked hard enough.
  3. Listen, don’t just calculate. A lot of my insights about the election came from listening to what people were saying, not from crunching datasets. As the environment around your company changes, you need to spend a lot more time with qualitative, unstructured content. Why? Because structured data collection reflects historical assumptions, and may very well be missing the key variables required to fully understand changing customer attitudes and behaviors.
  4. Over-emphasize recency. If you’re building a predictive model, make sure that it is very sensitive to recent data. If you’re mapping out a long-term trend or trying to fit the data to a historical model, it may take a while for you to identify a substantive change in the environment. Even if you don’t change your core model, look at what it says if you significantly over-weight recent data points.
  5. Modernize your leadership. The way that organizations can and should use data is one of the shifts that is making traditional management techniques obsolete. That’s why you should adopt what I call Modernize Leadership: Shifting 8 Outdated Management Practices. This requires making a shift to Engage & Empower, Learn & Adjust, Detect & Disseminate, Observe & Improve, Purpose & Values, Strengths & Appreciation, Culture & Behaviors, and Experience & Emotions.

The bottom line: It’s hard to project from the past when the future is changing.

Report: State of Voice of the Customer Programs, 2016

1610_stateofvocprograms2016_coverWe published a Temkin Group report, State of Voice of the Customer Programs, 2016. This is the sixth year that we’ve benchmarked the competency & maturity of voice of the customer programs within large organization. Here’s the executive summary:

For the sixth straight year, Temkin Group has benchmarked the competency and maturity levels of voice of the customer (VoC) programs within large organizations. We found that while most companies think that their VoC efforts are successful, less than one-third of companies actually consider themselves good at reviewing implications that cut across the organization. Respondents think that in the future, the most important source of insights will be customer interaction history and the least important source will be multiple-choice questions. And although respondents believe that technology will play an increasingly important role in their VoC efforts, they also cite “integration across systems” as the biggest obstacle to their VoC success, and this concern has only grown in the past year. In addition to asking questions about their VoC program, we also had respondents complete Temkin Group’s VoC Competency and Maturity Assessment, which examines capabilities across what we call the “Six Ds”: Detect, Disseminate, Diagnose, Discuss, Design, and Deploy. Only 16% of companies have reached the two highest levels of VoC maturity, while 43% remain in the bottom two levels. When we compared higher-scoring VoC programs with lower-scoring programs, we found that companies with mature programs are more successful, they focus more on analytics, and they have more full-time staff, more strongly coordinated efforts, and more involved senior executives.

See the State of VoC reports from 2010201120132014, and 2015.

Download report for $195
BuyDownload3

Here are the results from Temkin Group’s VoC Competency & Maturity Assessment:

1610_vocmaturity

Download report for $195
BuyDownload3

Report: Net Promoter Score Benchmark Study, 2016

1610_npsbenchmarkstudy_coverWe published a Temkin Group report, Net Promoter Score Benchmark Study, 2016. This is the fifth year of this study that includes Net Promoter® Scores (NPS®) on 315 companies across 20 industries based on a study of 10,000 U.S. consumers. Here’s the executive summary:

As many large companies use Net Promoter® Score (NPS) to evaluate their customer loyalty, Temkin Group measured the NPS of 315 companies across 20 industries. With an NPS of 68, USAA’s insurance business earned the highest score in the study for the fourth year in a row. Four other companies also earned an NPS of 60 or higher: Cadillac, USAA’s banking business, Apple, and USAA’s credit card business. In addition to earning some of the top scores, USAA’s banking, credit card, and insurance businesses also all outpaced their respective industries’ averages by more than any other company. Comcast, meanwhile, earned the lowest NPS for the second year in a row, coming in just below Time Warner Cable, Cox Communications, and McDonalds. And while all 20 industries increased their average NPS from last year, utilities enjoyed the biggest improvement in its score. Out of all the companies, US Airways’s and Advantage Rent-A-Car’s scores improved the most, whereas TriCare’s and Lexus’s scores declined the most. On average across the industries, the youngest consumers gave companies the lowest NPS, while 35- to 44-year-olds gave them the highest NPS.

See the NPS Benchmark Studies from 2012, 20132014, and 2015.

Here’s a list of companies included in this study (.pdf).

Download report for $495
(includes report (in .pdf) plus dataset in Excel)
BuyDownload3

Here are the NPS scores across 20 industries:
1610_rangeofindustrynps

Here are some other highlights of the research:

  • Five industries toped the list with an average NPS of 40 or more: auto dealers, software, investments, computers & tablets, and appliances.
  • The bottom scoring industries are TV service providers, Internet service providers, and health plans.
  • USAA’s insurance, banking, and credit card businesses earned NPS levels that are 30 or more points above their industry averages. Five other firms are 20 or more points above their peers: com, credit unions, Chick-fil-A, Apple, and Trader Joe’s.
  • Five companies fell 25 or more points below their industry averages: RadioShack, Motel 6, eMachines, McDonalds, and Days Inn.
  • US Airway’s NPS increased by 31 points between 2015 and 2016, the largest increase of any company. Eight other companies improved by 25 or more points: Fifth Third, 21st Century, Fujitsu, DHL, MetLife, HSBC, Commonwealth Edison, PSE&G, and Hannaford.
  • TriCare, Lexus, Mercedes-Benz, Baskin Robins, and Nordstrom had double-digit declines in NPS between 2015 and 2016.

Download report for $495
(includes report (in .pdf) plus dataset in Excel)
BuyDownload3

If you want to know what data is included in this report and dataset, download this sample Excel dataset file.Screen Shot 2014-10-17 at 4.05.17 PM

P.S. Net Promoter Score, Net Promoter, and NPS are registered trademarks of Bain & Company, Satmetrix Systems, and Fred Reichheld.

Report: Tech Vendor NPS Benchmark, 2016 (B2B)

1609_technpsbenchmark_coverWe just published a Temkin Group report, Tech Vendor NPS Benchmark, 2016, The research examines Net Promoter Scores and the link to loyalty for 62 tech vendors based on feedback from 800 IT decision makers in large North American organizations. We also compared overall results to our benchmarks from the previous four years. Here’s the executive summary:

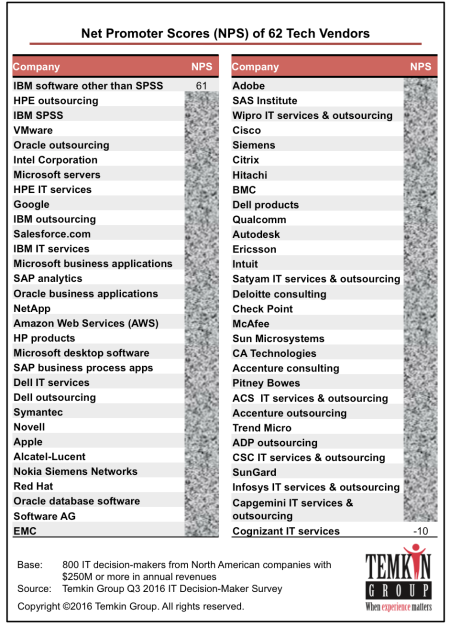
For the fifth year in a row, we examined the link between Net Promoter Scores® (NPS®) and loyalty for technology vendors. We surveyed 800 IT decision-makers from large North American firms to learn about their relationships with their technology providers. Of the 62 tech vendors we evaluated, IBM, HPE outsourcing, IBM SPSS, and VMware earned the highest NPS, while Cognizant, Capgemini, and Infosys received the lowest. Overall, the average NPS for the tech vendor industry decreased by almost 2 percentage points from last year. Our analysis shows that promoters are much more likely than detractors to increase their spending with tech vendors, try new products and services when they are announced, and forgive tech vendors after a bad experience. We also found that Software AG and HPE outsourcing are the top companies for purchase momentum, while IBM SPSS, IBM software, and IBM outsourcing have the highest Temkin Innovation Equity Quotient, and HPE outsourcing and IBM SPSS are at the top of the Temkin Forgiveness Ratings.

The report includes graphics with data for NPS, purchase intentions, likelihood to forgive, and likelihood to try a new offering. The excel spreadsheet includes this data (in more detail) for the 62 companies as well as for other tech vendors with less than 40 pieces of feedback. It also includes the summary NPS scores from 2015.

Download report for $695
(includes Excel spreadsheet with data)
BuyDownload3

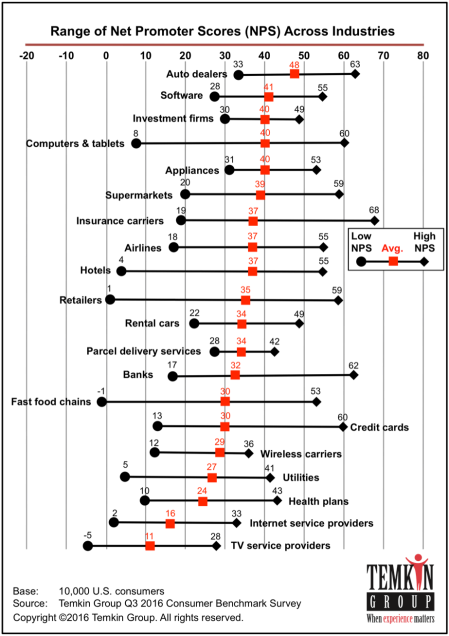
As you can see in the chart below, the NPS ranges from a high of 61 for IBM software down to  a low of -10 for Cognizant IT services.

1609_techvendornpsclear

The industry average NPS decreased to 29.9 this year. The research also includes data for Purchase Momentum (how much customers are planning to buy), Temkin Forgiveness Ratings (likelihood of customers to forgive after a bad experience), and Temkin Innovation Equity Quotient (likelihood of customer to try a new offering). We not only list the results for each company, but we also show that NPS is highly correlated to each of these items (as you can see below for Purchase Momentum).

1609_techvendornpstrendandcorrelatoin

Report details: When you purchase this research, you will receive a written report and an excel spreadsheet with more data. The report includes graphics with data for NPS, purchase momentum, Temkin Forgiveness Ratings, and Temkin Innovation Equity Quotient for the 62 tech vendors that had at least 40 pieces of feedback. The excel spreadsheet includes this data (in more detail) for the 62 companies as well as for other tech vendors with less than 40 pieces of feedback. It also includes the summary NPS scores from 2015. If you want to know more about the data file, download this SAMPLE SPREADSHEET without the data (.xls).

Download report for $695
(includes Excel spreadsheet with data)
BuyDownload3

Note: See our 2015 NPS benchmark2014 NPS benchmark2013 NPS benchmark and 2012 NPS benchmark for tech vendors as well as our page full of NPS resources.

P.S. Net Promoter Score, Net Promoter, and NPS are registered trademarks of Bain & Company, Satmetrix Systems, and Fred Reichheld.

Use Customer Insights To Close Four Loops

Companies that have voice of the customer (VoC) programs (including NPS) often put in place a closed-loop process. Those efforts often focus on closing a single loop, immediately responding to a customer after they respond to a survey. But this represents only one of four loops that companies need to close.

In the report, Make Your VoC Action-Oriented, we introduced the concept of four closed loops.

1608_FourActionLoops
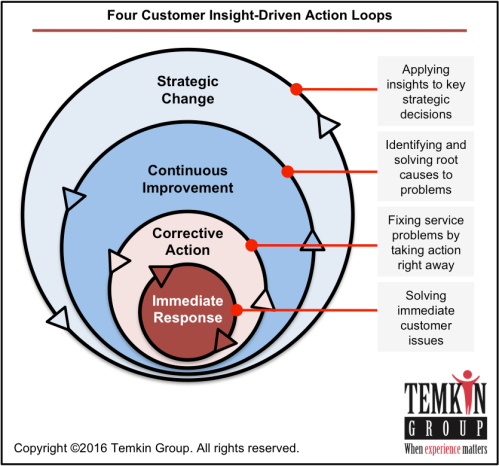
Here’s an example of the four loops for a restaurant chain:

  • Immediate Response. Reach out to a restaurant customer who responded on a survey that the bathroom was dirty and help take care of her ongoing concerns.
  • Corrective Action. Get the manager or employee to clean the bathroom in that restaurant.
  • Continuous Improvement. Create new process for restaurants to check and clean bathrooms on a regular basis.
  • Strategic Change. As part of new restaurant formats, design bathrooms so that they don’t require as much time from employees to keep them clean.

The bottom line: Make sure to build out four closed loops.

Report: Five C’s of Mobile VoC Disruption

1607_MobileVOCDisruption_COVERWe just published a Temkin Group report, Five C’s of Mobile VoC DisruptionBest Practices for Embracing the Power of Mobile in Your Voice of the Customer Program.

As mobile continues to grow in importance, companies will need to renovate their voice of the customer (VoC) programs. Why? Because mobile is more than just another communications channel – it is transforming the way that companies and customers interact. To help companies modernize their VoC programs to account for this increase in mobile usage, we’ve identified the key areas in which mobile is different from other channels, what we call the “Five C’s of Mobile VoC Disruption: “Condensed, Comprehensive, Current, Conversational, and Contextual. These disruptive characteristics will force companies to redefine how they capture, share, and act on customer insights. We’ve identified more than 20 best practices that span all areas of a VoC program, including soliciting in-the-moment feedback for key interactions and accelerating the sharing of useful insights. In order to use mobile successfully, companies need to evolve through three stages of change: 1) Mobile-Enabled, 2) Mobile-Adjusted, and 3) Mobile-First.

Download report for $195
BuyDownload3

Here’s an overview of the Five C’s:

5CsOfMobileVoC

Download report for $195
BuyDownload3

Quick Take: The Power of Customer Journey Thinking (Video)

In a recent Customer Experience Professionals Association (CXPA.org) CustomerSpark event in Dallas, I spoke about the importance of focusing on emotion. Given that we’ve called 2016 “The Year of Emotion,” this is a popular topic for Temkin Group.

Here’s a short snippet from my speech (one of several quick take videos from the event), which focuses on the power of Customer Journey Thinking™:


Want more information on Customer Journey Thinking? Check out the post, Five Questions That Drive Customer Journey Thinking.

And don’t forget to join the Intensify Emotion Movement.
IntensifyEmotionLogo