
We recently released the 2016 Temkin Experience Ratings that ranks the customer experience of 294 companies across 20 industries based on a survey of 10,000 U.S. consumers.
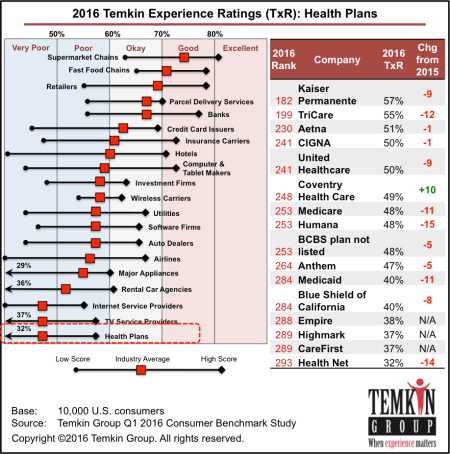
Kaiser Permanente and TriCare deliver the best customer experience of any health plan, according to the 2016 Temkin Experience Ratings, an annual customer experience ranking of companies based on a survey of 10,000 U.S. consumers.
Of the 16 health plans we looked at, Kaiser Permanente earned the highest score with a rating of 57%, placing it 182nd overall out of 294 companies across 20 industries. TriCare came in second in the industry with a rating of 55% and an overall ranking of 199th. Kaiser Permanente and TriCare have been jockeying for the highest health plan score since the Ratings began in 2011. The only other health plans to receive ratings above “very poor” (above 50%) were Aetna, CIGNA, and United Healthcare. Meanwhile, Health Net received the lowest score of any health plan with a rating of 32%, putting it in 293rd place out of 294 companies.
Overall, the health plan industry averaged a 47% rating in the 2016 Temkin Experience Ratings and tied for last place out of 20 industries. The average rating of the industry decreased by seven percentage-points between 2015 and 2016, dropping from 54% to 47%.
Here are some additional findings from the health plan industry: Read more of this post
Filed under 2016 Temkin Ratings, Customer experience
Tagged with Aetna, Anthem (BCBS), BCBS plan not listed, Blue Shield of California, CareFirst (BCBS), Cigna, Coventry Health Care, Empire BCBS, Health Net, Highmark BCBS, Humana, Kaiser Permanente, Medicaid, Medicare, TriCare, United Healthcare
We recently released the 2015 Temkin Experience Ratings which ranks the customer experience of 293 companies across 20 industries based on a survey of 10,000 U.S. consumers.
Overall, health plans averaged a 54% rating and placed 18th out of 20 industries.
TriCare took the top spot with a rating of 67%, placing it 128th overall out of 293 companies across 20 industries. Kaiser Permanente came in second with a rating of 66% and an overall ranking of 136th. TriCare and Kaiser Permanente have been jockeying for the highest score since the Ratings began in 2011, with TriCare earning the top spot in 2011, 2013, and 2015, while Kaiser Permanente came in first in 2012 and 2014.
At the other end of the spectrum, Coventry Health Care was both the lowest-scoring health plan, and the lowest scoring company we evaluated in the entire Ratings. Coventry Health Care scored 39%, making it the lowest-ranked company for the second year in a row.
Here are some other highlights:
- The average rating for the health plan industry dropped from 56% in 2014 to 54% in 2015—the first time that this industry’s average declined.
- Of the twelve health plans that we looked at in both 2014 and 2015, Medicaid and TriCare were the only two to increase their scores over the last year. Medicaid’s rating went up by six percentage-points, while TriCare’s increased by five percentage-points.
- Although it scored below the industry averages for both effort and success, Health Net scored 1.7 points higher than the industry average for emotion, the overall lowest scoring component in the Ratings.
- The average rating of each of the three components dropped over the past year, but while success and effort each only dropped by one percentage-point, emotion dropped by three percentage-points. This is the first year since the Ratings began that the average score of any of the three components decreased.
Read more of this post
Filed under 2015 Temkin Ratings, Customer experience
Tagged with Aetna, Anthem, BCBS of Florida, BCBS of Michigan, BCBS plan not listed, Blue Shield of California, Cigna, Coventry Health Care, Health Net, Health plans, Humana, Kaiser Permanente, Medicaid, Medicare, TriCare, United Healthcare
We recently released the 2014 Temkin Experience Ratings that ranks the customer experience of 268 companies across 19 industries based on a survey of 10,000 U.S. consumers.
Kaiser Permanente earned the top spot with a 68% rating, positioning the company in 109th place overall out of 268 organizations across 19 industries. Humana, meanwhile, earned a rating of 63% and placed 160th overall. While Kaiser Permanente consistently ranks near the top of the list—even taking first place in 2012—this year, Humana ascended from the middle of the pack to the top, improving its rating by an astonishing 12 percentage points.
At the other end of the spectrum, Coventry Health Care (BCBS) plummeted down the ranks after declining 18 percentage points from 2013, leaving it in last place across all 268 companies in the ratings with a score of 41%. Empire (BCBS), Highmark (BCBS), and Medicaid joined Coventry as the lowest-rated companies across any industry.
Download entire dataset for $395


Here are some additional findings from the health plan industry:
Read more of this post
Filed under Customer experience
Tagged with Aetna, Anthem (BCBS), Blue Shield Of CA, CareFirst (BCBS), Cigna, Coventry Health Care, Empire BCBS, Health Net, Highmark BCBS, Humana, Kaiser Permanente, Medicaid, Medicare, TriCare, United Healthcare
 We just published a Temkin Group report, What Happens After a Good or Bad Experience, 2014. The report, which includes 19 data charts, examines which companies and industries provide the most bad experiences, what impact those experiences have on spending, and how the negative impacts of bad experiences can be mitigated by good service recovery. The report also examines how consumers share their good and bad experiences with companies as well as with other people. Here’s the executive summary:
To understand the effect of good and bad experiences, we asked 10,000 U.S. consumers about their recent interactions with 268 companies across 19 industries. Results show that Internet services and TV services are the industries most likely to deliver a bad experience to their customers, while grocery chains are the least likely to. At the company level, Scottrade had the smallest percentage of customers reporting a recent bad experience with the company and Time Warner Cable had the highest. More than half of the customers who encountered a bad experience at a fast food chain, credit card issuer, grocery store, or hotel either decreased their spending with the company or stopped altogether. However, our data shows that a good service recovery effort can help mitigate a bad experience. Unfortunately, many firms—especially in the banking, Internet services, and TV services sectors—aren’t very good at service recovery. In addition to the consequences of bad interactions, we also examined which channels customers use to share their good and bad experiences and how these changed across age groups. We then compared these results to survey responses from the past two years. We also uncovered a negative bias inherent in how customers provide feedback. ING Direct, Residence Inn, and Fairfield Inn have the most negative bias in the feedback they receive directly from customers, while Hy-Vee and Hyundai have the most negative bias on Facebook.
Click link to see full list of industries and companies covered in this report (.pdf).
Download report for $195
One of the most interesting analyses in the report is the look at how service recovery after a bad experience affects the spending pattern of consumers. Here’s a summary of one of the charts showing just how important it is for a company to recover well after making a mistake:

Here are some other insights from the research:
- Sixteen percent of consumers who have interacted with TV service and Internet service providers report having a bad experience over the previous six months. Next on the list are wireless carriers, with 12% of their customers reporting a bad experience. At the other end of the spectrum, only 3% of consumers report a bad experience with grocery chains and 4% report having a bad experience with fast food chains.
- The five companies with the most customers reporting bad experiences are Time Warner Cable (25%), Motel 6 (22%), Coventry Health Care (21%), and Comcast (21%). There were 10 companies with only 1% or less of their customers reporting bad experiences: Scottrade, Chick-fil-A, H.E.B., Whole Foods, ShopRite, ING Direct, Starbucks, Trader Joe’s, Vanguard, and True Value.
- More than one-quarter of consumers who have a bad experience stop spending with computer makers, car rental agencies, credit card issuers, hotel chains, and software companies. The impact of bad experiences is less costly for parcel delivery services, wireless carriers, health plans, TV service providers, Internet service providers, and grocery chains, as less than 15% of their customers with bad experience stopped spending.
- The industries that are the best at responding to a bad experience are investment firms, major appliances, retailers, and car rental agencies. The industries that are the worst at responding to a bad experience are TV service providers, wireless carriers, Internet service providers, parcel delivery services, and health plans.
- Thirty-two percent of consumers give feedback directly to companies after a very bad experience and 23% give feedback after a very good experience.
- Overall, 25- to 34-year-olds are the most likely to share feedback about their experiences. After a good experience 57% tell a friend directly, 28% share on Facebook, and 18% put a comment or rating on a review site. After a bad experience, 60% tell a friend directly, 31% share on Facebook, and 20% write a review.
Download report for $195
The bottom line: Make sure to recover quickly after a bad experience
Filed under Benchmarks, Bruce Temkin Research, Customer Connectedness, Customer experience, Temkin Group Research, Trends
Tagged with 21st Century, 7-Eleven, A&P, AAA, Ace Hardware, Acer, Activision, Adobe, Advance Auto Parts, Aetna, AIG, AirTran Airways, ALamo, Alaska Airlines, Albertsons, Aldi, Allstate, Amazon.com, American Airlines, American Express, American Family, Ameriprise Financial, Anthem, AOL, Apple, Arby's, AT&T, Audi, AutoZone, Avis, Bank Of America, Barclaycard, Barnes & Noble, Baskin Robbins, Bed Bath & Beyond, Best Buy, Best Western, BJs Wholesale Club, Blackboard, Blue Shield of California, BMW, Bosch, Bright House, Budget, Buick, Burger King, Cablevision, Cadillac, Capital One, CareFirst, Charles Schwab, Charter Communications, Chase, Chevrolet, Chick-fil-A, Chrysler, Cigna, Citibank, Citigroup, Citizens, Comcast, Comfort Inn, Compaq, Costco, Courtyard By Marriott, Coventry Health Care, Cox Communications, credit unions, Crowne Plaza, CVS, Dairy Queen, Days Inn, Dell, Delta, DHL, DirecTV, Discover, Dish Network, Dodge, Dollar, Dollar General, Dollar Tree, Domino's, Dunkin' Donuts, E*Trade, eBay, Edward Jones, Electrolux, eMachines, Empire, Enterprise, Fairfield Inn, Family Dollar, Farmers, FedEx, Fidelity Investments, Fifth Third, Food Lion, Foot Locker, Ford, Fujitsu, GameStop, Gap, Gateway, GE, Geico, Giant Eagle, GM, Google, H.E.B, Haier, Hampton Inn, Hardees, Health Net, Hertz, Hewlett-Packard, Highmark, Hilton, Hitachi, Holiday Inn, Holiday Inn Express, Home Depot, Honda, HSBC, Humana, Hy-Vee, Hyatt, Hyundai, ING Direct, Intuit, Jack in the Box, JCPenney, Jeep, JetBlue Airlines, Kaiser Permanente, KFC, Kia, Kmart, Kohl's, Kroger, La Quinta Inn, Lenovo, Lexus, LG, Liberty Mutual, Little Caesar's, Lowe's, Macy's, Marriott, Marshalls, Mazda, McAfee, McDonalds, Medicaid, Medicare, Mercedes Benz, Merrill Lynch, MetLife, MetroPCS, Microsoft, Morgan Stanley Smith Barney, Motel 6, MSN, National, Nationwide, New York Life, Nissan, Nordstrom, O'Reilly Auto Parts, Office Depot, OfficeMax, Old Navy, Optimum (iO)/Cablevision, Orange Julius, PetSmart, Piggly Wiggly, Pizza Hut, PNC, Progressive, Publix, Quality Inn, Quiznos, QVC, Qwest, RadioShack, Regions, Residence Inn, Rite Aid, Ross, Safeway, Sam's Club, Samsung, Save-a-Lot, Scottrade, Sears, Sheraton, ShopRIte, Sonic Drive-In, Sony, Southwest Airlines, Sprint, Staples, Starbucks, State Farm, Stop & Shop, Subway, SunTrust Bank, Super 8, Symantec, T-Mobile, T.J. Maxx, Taco Bell, Target, TD Ameritrade, TD Bank, The Hartford, Time Warner Cable, Toshiba, Toyota, Toys "R" Us, TracFone, Trader Joe's, Travelers, TriCare, True Value, U.S. Bank, United Airlines, United Healthcare, UPS, US Airways, US Cellular, US Postal Service, USAA, Vanguard, Verizon, Verizon Wireless, Virgin Mobile, Volkswagen, Wal-Mart, Walgreens, Wells Fargo, Wendy's, Westin, Whirlpool, Whole Foods, Winn-Dixie
Today is the first day of Customer Service Week, so it’s a great opportunity to once again congratulate the industry leaders in the 2013 Temkin Customer Service Ratings (60% or more is a strong score):
- Airlines: Alaska Airlines (67%)
- Appliance maker: Whirlpool, Samsung (51%)
- Auto dealer: Toyota (62%)
- Bank: USAA (75%)
- Computer maker: Apple (57%)
- Credit card issuer: USAA (63%)
- Fast food chain: Chick-fil-A (70%)
- Grocery chain: Hy-Vee, Trader Joe’s (69%)
- Health plan: Kaiser Permanente, TriCare (59%)
- Hotel chain: Marriott (65%)
- Insurance carrier: USAA (76%)
- Internet service: AOL (47%)
- Investment firm: Charles Schwab (71%)
- Parcel delivery: FedEx (58%)
- Rental car agency: Advantage (68%)
- Retailer: Ace Hardware (71%)
- Software firm: Blackboard (56%)
- TV service: Bright House Networks (46%)
- Wireless carrier: Virgin Mobile (46%)
I also want to congratulate the organizations that are improving. These firms earned 2013 Temkin Customer Service Ratings that are 15 percentage points or more higher than their 2012 ratings: Citibank, U.S. Bank, Hyundai, Nissan. Citigroup, and Old Navy.
It’s also a good time to reiterate the distinction between customer service and customer experience. I like what Amazon.com’s CEO Jeff Bezos had to say on this topic:
“Internally, customer service is a component of customer experience. Customer experience includes having the lowest price, having the fastest delivery, having it reliable enough so that you don’t need to contact [anyone]. Then you save customer service for those truly unusual situations. You know, I got my book and it’s missing pages 47 through 58“
The bottom line: Happy Customer Service Week!
Filed under Customer experience, customer service
Tagged with Ace Hardware, Advantage, Alaska Airlines, AOL, Apple, Blackboard, bright House Networks, Charles Schwab, Chick-fil-A, Citibank, customer service week, FedEx, Hy-Vee, Hyundai, Kaiser Permanente, Marriott, Nissan. Citigroup, Old Navy, Toyota, Trader Joe's, TriCare, U.S. Bank, USAA, Virgin Mobile, Whirlpool
We just released the third annual Temkin Customer Service Ratings of 235 companies across 19 industries based on a study of 10,000 U.S. consumers (see full list of firms).
Download entire dataset for $295
Company Results
Here are some company highlights:


- USAA earned the top two spots for its insurance and banking businesses. Other companies at the top of the ratings are credit unions, Ace Hardware, Charles Schwab, Dollar Tree, Chick-fil-A, Sonic Drive-In, Hy-Vee, Costco, Trader Joe’s, Advantage, Publix, and H.E.B.
- TV service providers and Internet service providers earned nine out of bottom 10 spots in the ratings.
- For the second straight year, Charter Communications took the bottom spot. The rest of the firms in the bottom five are Time Warner Cable, Cox Communications, Optimum (i/o), and CareFirst.
- The following companies earned ratings that were 15 or more points above their industry averages: USAA (insurance and banking), Alaska Airlines, credit unions, Advantage, Kaiser Permanente, TriCare, Charles Schwab, and Bright House Networks.
- Five companies earned ratings that were 15 or more points below their industry averages: Apple Stores, US Airways, RadioShack, HSBC, and 21st Century.
- Twenty-three percent of companies earned “strong” or “very strong” ratings, while 37% earned “weak” or “very weak” ratings.
Temkin Group also examined year-over-year results for the 171 companies that were in both the 2012 and 2013 Temkin Customer Service Ratings and found that:
- Forty-four percent of companies improved their ratings while 47% experienced a decline.
- Twenty companies showed double-digit increases, led by: Citibank (banking and credit cards), U.S. Bank, Hyundai, Nissan, Old Navy, Charles Schwab, Continental Airlines, and Piggly-Wiggly.
- Eleven companies showed double-digit decreases, led by: LG, Giant Eagle, Toshiba, Cox Communications, ING Direct, and Budget.
Industry Results
Here are some industry highlights:
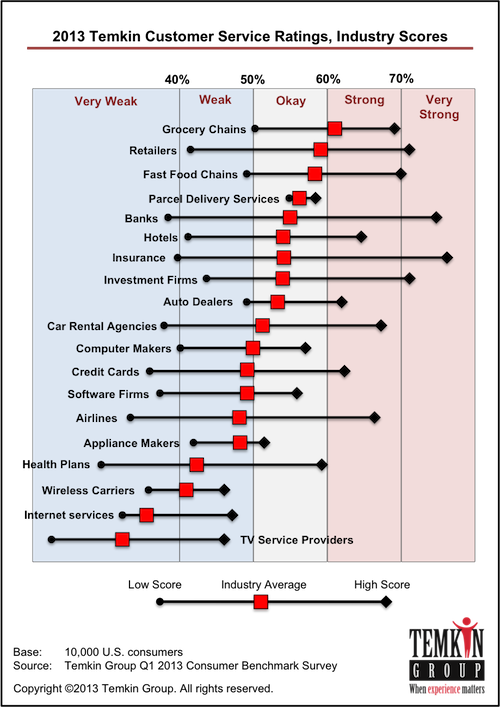
- Grocery chains, retailers, and fast food chains earned the highest average Temkin Customer Service Ratings, while TV service providers, Internet service providers, wireless carriers, and health plans earned the lowest ratings.
- On average, credit card issuers, banks and fast food restaurants improved the most while appliance makers, TV service providers and investment firms declined the most.
Calculating the Temkin Customer Service Ratings
During January 2013, Temkin Group asked 10,000 U.S. consumers to identify the companies that they had interacted with on their websites during the previous 60 days. These consumers were asked the following question:
Thinking back to your most recent customer service interaction with these companies,
how satisfied were you with the experience?
Responses from 1= “very dissatisfied” to 7= “very satisfied”
For all companies with 100 or more consumer responses, we calculated the “net satisfaction” score. The Temkin Customer Service Ratings are calculated by taking the percentage of consumers that selected either “6” or “7” and subtracting the percentage of consumers that selected either “1,” “2,” or “3.”
Download entire dataset for $295

To see all of the companies in the Temkin Customer Service Ratings as ell as all of our other Temkin Ratings and sort through the results, visit the Temkin Ratings website
The bottom line: TV service providers deliver terrible customer service
Filed under 2013 Temkin Ratings, Customer experience, customer service
Tagged with 21st Century, 7-Eleven, A credit union, AAA, Ace Hardware, Acer, Activision, Adobe, Advance Auto Parts, Advantage, Aetna, AirTran Airways, ALamo, Alaska Airlines, Albertsons, Aldi, Allstate, Amazon.com, American Airlines, American Express, American Family, Ameriprise Financial, Anthem (BCBS), AOL, Apple, Apple Store, Arby's, AT&T, AutoZone, Avis, Bank Of America, Barnes & Noble, Bed Bath & Beyond, Best Buy, Best Western, BJs Wholesale Club, Blackboard, Blue Shield of California, BMW, Bosch, bright House Networks, Budget, Burger King, Cablevision, Capital One, CareFirst (BCBS), Charles Schwab, Charter Communications, Chase, Chevrolet, Chick-fil-A, Chrysler, Cigna, Citibank, Citigroup, Citizens, Comcast, Comfort Inn, Compaq, Continental Airlines, Costco, Courtyard By Marriott, Coventry Health Care, Cox Communications, Crowne Plaza, CVS, Dairy Queen, Days Inn, Dell, Delta / Northwest Airlines, DirecTV, Discover, Dish Network / EchoStar, Dodge, Dollar, Dollar General, Domino's, Dunkin' Donuts, E*Trade, Earthlink, Edward Jones, Electrolux, eMachines, Empire BCBS, Enterprise, Fairfield Inn, Farmers, FedEx, Fidelity Investments, Fifth Third, Food Lion, Ford, Gateway, GE, Geico, Giant Eagle, Google, H.E.B, Hampton Inn, Hardees, Health Net, Hertz, Hewlett-Packard, Highmark BCBS, Hilton, Holiday Inn, Holiday Inn Express, Honda, HSBC, Humana, Hy-Vee, Hyatt, Hyundai, ING Direct, Intuit, Jack in the Box, JetBlue Airlines, Kaiser Permanente, KFC, Kia, Kroger, La Quinta, Lenovo, LG, Liberty Mutual, Little Caesar's, Marriott, McAfee, McDonalds, Med, Medicaid, Merrill Lynch, MetLife, MetroPCS, Microsoft, Morgan Stanley Smith Barney, Motel 6, MSN (Microsoft Network), Nationwide, Nissan, Optimum (iO) / Cablevision, Piggly Wiggly, Pizza Hut, PNC, Progressive, Publix, Quiznos, Qwest, Regions, Road Runner, S, Safeway, Samsung, Save-a-Lot, Scottrade, ShopRIte, Sonic Drive-In, Sony, Southwest Airlines, Sprint, Starbucks, State Farm, Stop & Shop, SunTrust Bank, Symantec, T-Mobile, TD Ameritrade, TD Bank, The Hartford, Time Warner Cable, Toshiba, Toyota, TracFone, Trader Joe's, Travelers, U.S. Bank, U.S. Cellular, U.S. Postal Service, United Airlines, UPS, US Airways, USAA, Verizon, Verizon Wireless, Virgin Mobile, Wells Fargo, Whirlpool, Whole Foods, Winn-Dixie
We just released the third annual Temkin Web Experience Ratings of 211 companies across 19 industries based on a study of 10,000 U.S. consumers (see full list of firms).
Download entire dataset for $295
Company Results
Here are some company highlights:

- For the third straight year, Amazon.com topped the Temkin Web Experience Ratings while USAA took the next two spots for its bank and insurance businesses.
- Other companies at the top of the ratings are Regions, U.S. Bank, eBay, Advantage Rent A Car, credit unions, and QVC.
- At the other end of the spectrum, MSN, Health Net, EarthLink, and Cablevision earned the lowest ratings.
- Only 6% of companies earned “strong” or “very strong” ratings, while 63% earned “weak” or “very weak” ratings.
- Amazon.com and USAA’s insurance business earned ratings that were 20 points above their industry averages and eight other companies were at least 10 points above their peers: Kaiser Permanente, Advantage Rent A Car, eBay, QVC, USAA (bank), Sonic Drive-In, Charles Schwab, and Fidelity Investments.
- Health Net and RadioShack earned ratings that were 20 points or more less than their industry averages and six other companies were at least 15 points below their peers: 21st Century, American Family, Days Inn, Taco Bell, and Kmart.
Temkin Group examined year-over-year results for the 154 companies that were in the 2012 and 2013 ratings and found that:
- Forty-one percent of companies improved, while 53% declined.
- Over half of the companies that were in the 2012 and 2013 ratings earned lower scores this year.
- Eight companies showed double-digit increases: Humana, Old Navy, U.S. Bank, Citibank, TriCare, Blue Shield of California, Toyota, and Safeway.
- Twenty-one companies declined by at least 10 points and six companies dropped by more than 15 points: Southwest Airlines, MSN, United Airlines, ShopRite, Cablevision, and Bright House Networks.
Industry Results
Here are some industry highlights:

- Banks earned the highest average Temkin Web Experience Ratings, followed by investment firms, retailers, credit card issuers, and hotel chains.
- Five industries earned average ratings of “very weak” ratings: Internet service providers, TV service providers, airlines, health plans, and wireless carriers.
- Seven industries improved between 2012 and 2013., while nine declined. Airlines suffered the most dramatic drop, losing 15 points.
Calculating the Temkin Web Experience Ratings
During January 2013, Temkin Group asked 10,000 U.S. consumers to identify the companies that they had interacted with on their websites during the previous 60 days. These consumers were asked the following question:
Thinking back to your most recent interaction with the websites of these companies,
how satisfied were you with the experience?
Responses from 1= “very dissatisfied” to 7= “very satisfied”
For all companies with 100 or more consumer responses, we calculated the “net satisfaction” score. The Temkin Web Experience Ratings are calculated by taking the percentage of consumers that selected either “6” or “7” and subtracting the percentage of consumers that selected either “1,” “2,” or “3.”
Download entire dataset for $295
To see all of the companies in the Temkin Trust Ratings as ell as all of our other Temkin Ratings and sort through the results, visit the Temkin Ratings website
The bottom line: Web experiences are heading in the wrong direction.
Filed under 2013 Temkin Ratings, Customer experience
Tagged with 21st Century, 7-Eleven, A credit union, AAA, Ace Hardware, Acer, Activision, Adobe, Advance Auto Parts, Advantage, Aetna, AirTran Airways, ALamo, Alaska Airlines, Albertsons, Aldi, Allstate, Amazon.com, American Airlines, American Express, American Family, Ameriprise Financial, Anthem (BCBS), AOL, Apple, Apple Store, Arby's, AT&T, AutoZone, Avis, Bank Of America, Barnes & Noble, Bed Bath & Beyond, Best Buy, Best Western, BJs Wholesale Club, Blackboard, Blue Shield of California, BMW, Bosch, bright House Networks, Budget, Burger King, Cablevision, Capital One, CareFirst (BCBS), Charles Schwab, Charter Communications, Chase, Chevrolet, Chick-fil-A, Chrysler, Cigna, Citibank, Citigroup, Citizens, Comcast, Comfort Inn, Compaq, Continental Airlines, Costco, Courtyard By Marriott, Coventry Health Care, Cox Communications, Crowne Plaza, CVS, Dairy Queen, Days Inn, Dell, Delta / Northwest Airlines, DirecTV, Discover, Dish Network / EchoStar, Dodge, Dollar, Dollar General, Domino's, Dunkin' Donuts, E*Trade, Earthlink, Edward Jones, Electrolux, eMachines, Empire BCBS, Enterprise, Fairfield Inn, Farmers, FedEx, Fidelity Investments, Fifth Third, Food Lion, Ford, Gateway, GE, Geico, Giant Eagle, Google, H.E.B, Hampton Inn, Hardees, Health Net, Hertz, Hewlett-Packard, Highmark BCBS, Hilton, Holiday Inn, Holiday Inn Express, Honda, HSBC, Humana, Hy-Vee, Hyatt, Hyundai, ING Direct, Intuit, Jack in the Box, JetBlue Airlines, Kaiser Permanente, KFC, Kia, Kroger, La Quinta, Lenovo, LG, Liberty Mutual, Little Caesar's, Marriott, McAfee, McDonalds, Med, Medicaid, Merrill Lynch, MetLife, MetroPCS, Microsoft, Morgan Stanley Smith Barney, Motel 6, MSN (Microsoft Network), Nationwide, Nissan, Optimum (iO) / Cablevision, Piggly Wiggly, Pizza Hut, PNC, Progressive, Publix, Quiznos, Qwest, Regions, Road Runner, S, Safeway, Samsung, Save-a-Lot, Scottrade, ShopRIte, Sonic Drive-In, Sony, Southwest Airlines, Sprint, Starbucks, State Farm, Stop & Shop, SunTrust Bank, Symantec, T-Mobile, TD Ameritrade, TD Bank, The Hartford, Time Warner Cable, Toshiba, Toyota, TracFone, Trader Joe's, Travelers, U.S. Bank, U.S. Cellular, U.S. Postal Service, United Airlines, UPS, US Airways, USAA, Verizon, Verizon Wireless, Virgin Mobile, Wells Fargo, Whirlpool, Whole Foods, Winn-Dixie
We just released the third annual Temkin Trust Ratings of 246 companies across 19 industries (see full list).
Download entire dataset for $295
Company Results
For the third straight year, USAA‘s insurance business earned the top ranking in the Temkin Trust Ratings. Here are additional highlights:

- Two of USAA’s business areas —insurance and banking—topped the list of companies. USAA’s credit card business also ranked sixth.
- The other companies in the top 10 of the ratings are credit unions, Publix, H.E.B., Amazon.com, Trader Joe’s, Charles Schwab, and Sam’s Club.
- HSBC earned two of the bottom three spots for its credit card and banking businesses.
- TV service providers and Internet service providers dominate the bottom of the ratings, collectively taking 10 of the bottom 15 spots. The other companies in the bottom 15 are US Airways, CareFirst, and T-Mobile.
We also examined year-over-year results for 204 companies that were also in the 2012 Temkin Trust Ratings. Here are some highlights of that analysis:
- Citigroup in credit cards and Hyundai earned the largest jump (21 points) over their 2012 Temkin Trust Ratings. The other largest gainers are Alaska Airlines, Bank of America in credit cards and banking, Continental Airlines, Avis, and EarthLink.
- Cox Communications in TV service and Fifth Third in banking lost the most ground (17 points) since last year. The other largest decliners are HSBC in banking, PNC in banking, JCPenney, Bright House Networks, and eMachines in computers.
Industry Results
Here are the highlights of the 19 industries in the 2013 Temkin Trust Ratings:

- Grocery chains earn the most trust while TV service providers earn the least trust from their customers.
- Six companies earned Temkin Trust Ratings that are 20 percentage points or more above their industry average: USAA (banking, credit cards, insurance carriers), credit unions (banking), TriCare (health plans), and Kaiser Permanente (health plans).
- Four companies earned Temkin Trust Ratings that are 20 percentage points or more below their industry average: HSBC (banking and credit cards), US Airways (airlines), 21st Century (insurance carriers).
- Led by credit card issuers and rental car agencies, 14 of the 18 industries in the 2012 and 2013 Temkin Trust Ratings improved over last year’s scores. The only four industries with declining ratings are TV service providers, retailers, appliance makers, and insurance carriers.
Calculating the Temkin Trust Ratings
During January 2013, Temkin Group asked consumers to identify companies that they have interacted with during the previous 60 days. For a random subset of those companies, consumers are asked to rate companies as follows:
To what degree do you TRUST that these companies will take care of your needs?
Responses from 1= “do not trust at all” to 7= “completely trust”
For all companies with 100 or more consumer responses, we calculated the “net trust” score. The Temkin Trust Ratings are calculated by taking the percentage of consumers that selected either “6” or “7” and subtracting the percentage of consumers that selected either “1,” “2,” or “3.”
Download entire dataset for $295
To see all of the companies in the Temkin Trust Ratings as ell as all of our other Temkin Ratings and sort through the results, visit the Temkin Ratings website
The bottom line: Without a customer’s trust, it’s hard to expect her loyalty.
Filed under 2013 Temkin Ratings, Customer experience
Tagged with 21st Century, 7-Eleven, A credit union, AAA, Ace Hardware, Acer, Activision, Adobe, Advance Auto Parts, Advantage, Aetna, AirTran Airways, ALamo, Alaska Airlines, Albertsons, Aldi, Allstate, Amazon.com, American Airlines, American Express, American Family, Ameriprise Financial, Anthem (BCBS), AOL, Apple, Apple Store, Arby's, AT&T, AutoZone, Avis, Bank Of America, Barnes & Noble, Bed Bath & Beyond, Best Buy, Best Western, BJs Wholesale Club, Blackboard, Blue Shield of California, BMW, Bosch, bright House Networks, Budget, Burger King, Cablevision, Capital One, CareFirst (BCBS), Charles Schwab, Charter Communications, Chase, Chevrolet, Chick-fil-A, Chrysler, Cigna, Citibank, Citigroup, Citizens, Comcast, Comfort Inn, Compaq, Continental Airlines, Costco, Courtyard By Marriott, Coventry Health Care, Cox Communications, Crowne Plaza, CVS, Dairy Queen, Days Inn, Dell, Delta / Northwest Airlines, DirecTV, Discover, Dish Network / EchoStar, Dodge, Dollar, Dollar General, Domino's, Dunkin' Donuts, E*Trade, Earthlink, Edward Jones, Electrolux, eMachines, Empire BCBS, Enterprise, Fairfield Inn, Farmers, FedEx, Fidelity Investments, Fifth Third, Food Lion, Ford, Gateway, GE, Geico, Giant Eagle, Google, H.E.B, Hampton Inn, Hardees, Health Net, Hertz, Hewlett-Packard, Highmark BCBS, Hilton, Holiday Inn, Holiday Inn Express, Honda, HSBC, Humana, Hy-Vee, Hyatt, Hyundai, ING Direct, Intuit, Jack in the Box, JetBlue Airlines, Kaiser Permanente, KFC, Kia, Kroger, La Quinta, Lenovo, LG, Liberty Mutual, Little Caesar's, Marriott, McAfee, McDonalds, Med, Medicaid, Merrill Lynch, MetLife, MetroPCS, Microsoft, Morgan Stanley Smith Barney, Motel 6, MSN (Microsoft Network), Nationwide, Nissan, Optimum (iO) / Cablevision, Piggly Wiggly, Pizza Hut, PNC, Progressive, Publix, Quiznos, Qwest, Regions, Road Runner, S, Safeway, Samsung, Save-a-Lot, Scottrade, ShopRIte, Sonic Drive-In, Sony, Southwest Airlines, Sprint, Starbucks, State Farm, Stop & Shop, SunTrust Bank, Symantec, T-Mobile, TD Ameritrade, TD Bank, The Hartford, Time Warner Cable, Toshiba, Toyota, TracFone, Trader Joe's, Travelers, U.S. Bank, U.S. Cellular, U.S. Postal Service, United Airlines, UPS, US Airways, USAA, Verizon, Verizon Wireless, Virgin Mobile, Wells Fargo, Whirlpool, Whole Foods, Winn-Dixie
All companies, even customer experience leaders, make mistakes. But how much goodwill have companies built up for consumers to forgive them after those miscues? To answer this question, Temkin Group surveyed 10,000 U.S. consumers about companies with whom they’ve recently interacted. We used this data for the third annual Temkin Forgiveness Ratings of 246 companies across 19 industries.
Download entire dataset for $295
Company Results
Here are the highlights of the 246 companies in the 2013 Temkin Forgiveness Ratings:
- Advantage earns top spot. With an excellent score of 61%, Advantage earned the highest rating.
- USAA dominates forgiveness. USAA grabbed the next three spots for its banking, insurance, and credit card businesses.
- The rest of the top 10. H.E.B., Blackboard, Aldi, Alaska Airlines, credit unions and Publix round out the top 10
- No industry owns the top. The top 25 companies in the ratings comes form a variety of industries: Four grocery chains, three airlines, three retailers, two banks, two hotel chains, two investment firms, two software firms, one appliance maker, one auto dealer, one credit card issuer, one fast food chain, one health plan, one insurance carrier, and one rental car agency.
- HSBC dominates the bottom. HSBC earned the bottom two spots in the ratings for its credit card and banking businesses.
- Many TV service providers are at the bottom. Six of the bottom 12 companies are TV service providers: Cox Communications, Time Warner Cable, Comcast, Verizon, Charter Communications, and Optimum (iO)/Cablevision.
- USAA most outperforms its peers. We compared company ratings with their industry averages and USAA came in the top three spots, 36 points above in banking, 31 points ahead in credit cards, and 28 points ahead in insurance. Three other companies are more than 20 points above their industry averages: Advantage (car rentals), credit unions (banking), and TriCare (health plans).
- HSBC most underperforms. HSBC fell the farthest below its industry average in two areas, 23 points behind its peers in banking and credit cards. Five other companies had scores that were 15 points and more below their industry: US Airways (airlines), Motel 6 (hotels), McAfee (software), Kia (auto dealers), and Hertz (rental cars).
We also examined year-over-year results for 204 companies that were in both the 2012 and 2013 Temkin Forgiveness Ratings. Here are some highlights of that analysis:
- Chrysler improves the most. With a jump of 29 percentage points, Chrysler is the most improved company. Six other companies gained 20 points or more: Continental Airlines, Citigroup, Avis, EarthLink, Ameriprise Financial, and Alaska Airlines.
- US Cellular declines the most. With a drop of nearly 20 percentage points, US Cellular dropped the most in 2013. Nine other companies fell by more than 10 points: Bright House Networks, HSBC, Cox Communications, Hertz, PNC, SunTrust Bank, Dollar Rental Car, Hyatt, and TD Ameritrade.
Industry Results
Here are the highlights of the 19 industries in the 2013 Temkin Forgiveness Ratings:

- TV service providers are unforgivable. TV service providers, as an industry, earned the lowest Temkin Forgiveness Rating of 12%. It was five points below Internet service providers and seven points below wireless carriers.
- Grocery chains are the most forgivable. With an average rating of 39%, grocery chains are the highest scoring industry. Three industries are just four points behind: hotel chains, auto dealers, and rental car agencies.
- Credit cards make the most improvements. Credit cards made the largest improvement, nine percentage points, over the previous year. Auto dealers, rental car agencies, and airlines also improved by more than five points.
- TV service providers head in the wrong direction. Led by TV service providers that dropped three points between 2012 and 2013, three industries earned lower scores in 2012. The other industries are retailers and appliance makers.
Calculating the Temkin Forgiveness Ratings
During January 2013, Temkin Group asked consumers to identify companies that they have interacted with during the previous 60 days. For a random subset of those companies, consumers are asked to rate companies as follows:
How likely are you to forgive these companies if they deliver a bad experience?
Responses from 1= “extremely unlikely” to 7= “extremely likely”
For all companies with 100 or more consumer responses, we calculated the “net forgiveness” score. The Temkin Forgiveness Ratings are calculated by taking the percentage of consumers that selected either “6” or “7” and subtracting the percentage of consumers that selected either “1,” “2,” or “3.”
Download entire dataset for $295
To see all of the companies in the Temkin Forgiveness Ratings as ell as all of our other Temkin Ratings and sort through the results, visit the Temkin Ratings website
The bottom line: Forgiveness is an asset that you accumulate by consistently meeting customer needs.
Filed under 2013 Temkin Ratings, Customer experience
Tagged with 21st Century, 7-Eleven, A credit union, AAA, Ace Hardware, Acer, Activision, Adobe, Advance Auto Parts, Advantage, Aetna, AirTran Airways, ALamo, Alaska Airlines, Albertsons, Aldi, Allstate, Amazon.com, American Airlines, American Express, American Family, Ameriprise Financial, Anthem (BCBS), AOL, Apple, Apple Store, Arby's, AT&T, AutoZone, Avis, Bank Of America, Barnes & Noble, Bed Bath & Beyond, Best Buy, Best Western, BJs Wholesale Club, Blackboard, Blue Shield of California, BMW, Bosch, bright House Networks, Budget, Burger King, Cablevision, Capital One, CareFirst (BCBS), Charles Schwab, Charter Communications, Chase, Chevrolet, Chick-fil-A, Chrysler, Cigna, Citibank, Citigroup, Citizens, Comcast, Comfort Inn, Compaq, Continental Airlines, Costco, Courtyard By Marriott, Coventry Health Care, Cox Communications, Crowne Plaza, CVS, Dairy Queen, Days Inn, Dell, Delta / Northwest Airlines, DirecTV, Discover, Dish Network / EchoStar, Dodge, Dollar, Dollar General, Domino's, Dunkin' Donuts, E*Trade, Earthlink, Edward Jones, Electrolux, eMachines, Empire BCBS, Enterprise, Fairfield Inn, Farmers, FedEx, Fidelity Investments, Fifth Third, Food Lion, Ford, Gateway, GE, Geico, Giant Eagle, Google, H.E.B, Hampton Inn, Hardees, Health Net, Hertz, Hewlett-Packard, Highmark BCBS, Hilton, Holiday Inn, Holiday Inn Express, Honda, HSBC, Humana, Hy-Vee, Hyatt, Hyundai, ING Direct, Intuit, Jack in the Box, JetBlue Airlines, Kaiser Permanente, KFC, Kia, Kroger, La Quinta, Lenovo, LG, Liberty Mutual, Little Caesar's, Marriott, McAfee, McDonalds, Med, Medicaid, Merrill Lynch, MetLife, MetroPCS, Microsoft, Morgan Stanley Smith Barney, Motel 6, MSN (Microsoft Network), Nationwide, Nissan, Optimum (iO) / Cablevision, Piggly Wiggly, Pizza Hut, PNC, Progressive, Publix, Quiznos, Qwest, Regions, Road Runner, S, Safeway, Samsung, Save-a-Lot, Scottrade, ShopRIte, Sonic Drive-In, Sony, Southwest Airlines, Sprint, Starbucks, State Farm, Stop & Shop, SunTrust Bank, Symantec, T-Mobile, TD Ameritrade, TD Bank, The Hartford, Time Warner Cable, Toshiba, Toyota, TracFone, Trader Joe's, Travelers, U.S. Bank, U.S. Cellular, U.S. Postal Service, United Airlines, UPS, US Airways, USAA, Verizon, Verizon Wireless, Virgin Mobile, Wells Fargo, Whirlpool, Whole Foods, Winn-Dixie

We published the 2013 Temkin Experience Ratings. The report analyzes feedback from 10,000 U.S. consumers to rate 246 organizations across 19 industries. Congratulations to the top firms in this year’s ratings: Publix, Trader Joe’s, Aldi, Chick-fil-A, Amazon.com, and Sam’s Club.
Download report for FREE
You can also download the data for $395.
The Temkin Experience Ratings are based on evaluating three elements of experience:
- Functional: How well do experiences meet customers’ needs?
- Accessible: How easy is it for customers to do what they want to do?
- Emotional: How do customers feel about the experiences?
Here are the top and bottom companies in the ratings:
 Here’s how the industries compare with each other:
(NOTE: We have published posts on the detailed results for all 19 industries)
 Here are the companies that are leaders and laggards across the 19 industries:

In this year’s ratings, 37% of companies earned “good” or “excellent” scores, while 28% are rated as “poor” or ”very poor.” Companies with at least a “good” rating grew by nine-percentage points since 2012 and by 21-points since 2011. Of the 203 companies that are included in both the 2012 and 2013 Temkin Experience Ratings, 57% firms had at least a modest increase. The companies that made the largest improvement over 2012 are Citibank, TriCare, TD Ameritrade, Office Depot, EarthLink, Hardees, and Regions Bank.
Download report for FREE
Get the Data
Do you want to see all of the data? You can purchase an excel spreadsheet for $395…

To view all of our ratings (experience, loyalty, trust, forgiveness, customer service, and web experience), visit the Temkin Ratings website…
The bottom line: Customer experience is improving, but there’s still a long way to go
Filed under 2013 Temkin Ratings, Benchmarks, Temkin Group Research, Trends
Tagged with AAA, Ace Hardware, Adobe, Advance Auto Parts, AirTran Airways, ALamo, Alaska Airlines, Aldi, Allstate, Amazon.com, American Airlines, American Family, Ameriprise Financial, Anthem (BCBS), Apple, Apple Store, AT&T, AutoZone, Avis, Bank Of America, Barnes & Noble, Bed Bath & Beyond, Best Buy, BJs Wholesale Club, Blackboard, Blue Shield of California, Bright House, Budget, Burger King, Cablevision, Capital One, CareFirst (BCBS), Charles Schwab, Charter Communications, Chase, Chevrolet, Chick-fil-A, Chrysler, Cigna, Citibank, Citigroup, Citizens, Comcast, Comfort Inn, Compaq, Continental Airlines, Costco, Courtyard By Marriott, Coventry Health Care, Cox Communications, Crowne Plaza, CVS, Dairy Queen, Days Inn, Dell, Delta Airlines, DirecTV, Discover, DISH Network/EchoStar, Dodge, Dollar, Dollar General, Dollar Tree, Domino's, Dunkin' Donuts, E*Trade, Earthlink, eBay, Edward Jones, Electrolux, eMachines, Empire BCBS, Enterprise, Fairfield Inn, Family Dollar, Farmers, Fidelity Investments, Fifth Third, Food Lion, Ford, GameStop, Gap, Gateway, GE, Geico, Giant Eagle, Google, H.E.B, Hampton Inn, Hardees, Health Net, Hertz Acer, Hewlett-Packard, Highmark BCBS, Hilton, Holiday Inn, Holiday Inn Express, Home Depot, Honda, HSBC, Humana, Hy-Vee, Hyatt, Hyundai, ING Direct, Intuit, Jack in the Box, JCPenney, JetBlue Airlines, Kaiser Permanente, KFC, Kia, Kmart, Kohl's, Kroger, La Quinta, Lenovo, LG, Liberty Mutual, Little Caesar's, Lowe's, Macy's, Marriott, Marshalls, McAfee, McDonalds, Medicaid, Medicare, Merrill Lynch, MetLife, MetroPCS, Microsoft, Morgan Stanley Smith Barney, Motel 6, MSN, Nationwide, Nissan, Nordstrom, O'Reilly Auto Parts, Office Depot, OfficeMax, Old Navy, Optimum (iO)/Cablevision, PetSmart, Piggly Wiggly, Pizza Hut, PNC, Progressive, Publix, Quality Inn 21st Century, Quiznos, QVC, Qwest, RadioShack, Regions, Rite Aid, Road Runner, Ross, Safeway, Sam Club, Samsung, Save-a-Lot, Scottrade, Sears, ShopRIte, Sonic Drive-In, Sony, Southwest Airlines, Sprint, Staples, Starbucks, State Farm, Stop & Shop, Subway, SunTrust Bank, Symantec AT&T, T.J. Maxx, Taco Bell, Target, TD Ameritrade, TD Bank, The Hartford, Time Warner Cable, Toshiba, Toshiba American Express, Toyota Credit unions, Toys "R" Us, TracFone, Trader Joe's, Travelers, TriCare, True Value, U.S. Bank, U.S. Cellular, U.S. Postal Service, United Airlines, United Healthcare Best Western, UPS 7-Eleven, US Airways BMW, USAA, USAA AOL, Vanguard, Verizon A credit union, Verizon AT&T, Verizon Wireless, Virgin Mobile, Wal-Mart, Walgreens Activision, Wells Fargo Advantage, Wells Fargo Advisors Bosch, Wells Fargo Arby's, Wendy’s Albertsons, Whirlpool FedEx, Whole Foods, Winn-Dixie Aetna
 We just published a Temkin Group report, What Happens After A Good or Bad Experience? This large-scale consumer study uncovers negatively biased feedback and significant upside from good service recovery. Here’s the executive summary:
We asked 5,000 U.S. consumers about their experiences with 179 companies across 19 industries. More than 60% who had a bad experience with a fast food chain, credit card issuer, rental car agency, or hotel cut back on their spending, and many stopped completely. But service recovery helps. For every level of improvement in how they responded to a bad experience, companies were rewarded with more sales. Unfortunately, firms aren’t very good at service recovery, especially banks and credit card issuers. TV service providers delivered the greatest number of bad experiences while grocery chains had the fewest. At a company level, ING Direct and Holiday Inn had the lowest number of bad experiences, while QVC and Best Buy had the highest. We also examined how consumers share their good and bad experiences, across age groups and income levels, and compared results from last year. This analysis uncovered a negative bias in how consumers give feedback. Motel 6, ING Direct, Albertsons, and RadioShack have the most negative bias in the feedback they get directly from customers; Cox Communications and Symantec have the most negative bias in feedback on Facebook; and Verizon and GE face the most negative bias on Twitter.
Download report for $195
The report has 20 graphics full of data on consumer behavior and company ratings. It starts by looking at the prevalence of bad experiences. It turns out that 20% of consumers have had a bad experience with a TV service provider while only 5% have had a bad experience with a grocery store.
 One of the streams of analysis looks at how consumers give feedback. As you can see, companies are more likely to hear about bad experiences than good experiences.
 Here are some of the other findings in the research:
- ING Direct (2%), Holiday Inn Express (2%) Whole Foods (3%) and Holiday Inn (3%) had the fewest occurrences of bad experience, while Best Buy (29%), QVC (29%), Gap (28%), and eBay (26%) had the most.
- After a bad experience consumers were most likely to completely stop spending with rental car agencies (40%), credit card issuers (39%), computer makers (35%), and auto dealers (35%), but least likely to stop spending with retailers (9%) and Internet service providers (10%).
- When companies responded very poorly after a bad experience, 47% of consumers stopped spending completely with the company. When they had a very good response, only 6% stopped spending and 37% increased their spending.
- Retailers (46%) most often recovered well from a bad experience while Internet service providers (15%) and health plans (15%) were the worst at recovering.
- 38% of consumers gave feedback directly to the company after a very bad experience, but only 31% gave feedback after a very good experience.
- 14% of consumers gave feedback on a rating site like Yelp after both a very good or a very bad experience.
- The use of twitter to communicate about a very bad experience has grown from 4% to 9% of consumers over the last year.
- 33% of 18- to 24-year-olds have posted about a good experience on Facebook, compared with only 5% of those who are 65 and older.
- 18% of 18- to 24-year-olds have tweeted about a good experience, compared with only about 1% of those who are 55 and older.
- 17% of consumers who earn $100K or more have tweeted about a bad experience, compared with only 7% of those who earn less than $50K.
- Given their customer demographics, Motel 6, ING Direct, Albertsons, and RadioShack are the most likely to receive direct customer feedback that is negatively biased while Cablevision, Avis, Nissan dealers, and Dodge dealers are the most likely to receive positively biased feedback.
- Given their customer demographics, Cox Communications, Symantec, ING Direct, and TracFone are the most likely to have negatively biased comments on Facebook, while Cablevision, AOL, Kaiser Permanente, and Holiday Inn are the most likely to have positively biased comments.
- Given their customer demographics, Verizon and GE are the most likely to have negatively biased comments on Twitter, while Avis and Edward Jones are most likely to have positively biased tweets.
Download report for $195
The bottom line: Customer feedback is an under utilized asset.
Filed under Benchmarks, Customer Connectedness, Customer experience, ROI of Customer Experience, Temkin Group Research, Trends, Voice of the customer
Tagged with Albertsons, AOL, Avis, Best Buy, Cablevision, Cox Communications, Dodge, eBay, Edward Jones, Gap, GE, Holiday Inn, Holiday Inn Express, ING Direct, Kaiser Permanente, Motel 6, Nissan, QVC, RadioShack, Symantec, TracFone, Verizon, Whole Foods
Our report The ROI of Customer Experience shows that customer experience is highly correlated to loyalty. The research analyzed the relationship between Temkin Loyalty Ratings and Temkin Experience Ratings (TER) for 206 U.S. companies.
After analyzing the connection between these ratings, we found that some companies seem to have higher loyalty levels than they seem to deserve based on their customer experience while others have lower loyalty levels.
Using that dataset, I compared actual loyalty levels with projected loyalty levels. How? By plugging each company’s experience rating into our regression model to identify what their loyalty rating should be (normalized to their industry average) based on its TER and compared that projected rating with its actual loyalty rating. In the chart below you can see the companies with the largest positive and negative variances from the model’s projections.
The companies with loyalty levels the most above the projections are USAA, Highmark, Medicaid, credit unions, and TriCare. The companies that fall the most below the projections are T-Mobile, BMW, Bosch, AT&T, and Alamo.
Let’s examine USAA as an example. Since it has very high experience ratings compared with its industry peers, our model projects that its loyalty ratings should be at the high end of banks, credit card issuers, and insurance carriers. This analysis shows that USAA’s actual loyalty levels are higher than expected, even after factoring in its wonderful customer experience.

So what?!? There’s nothing inherently good or bad with being above or below the projected loyalty level. There’s no reason to expect companies to fall directly on their projected loyalty levels.
What’s interesting about this analysis is not what’s good or bad, but WHY are some companies so far away from the projected levels. This is where I’ll leave the data behind and offer my interpretation about WHY some companies have higher than projected loyalty while others have lower than projected loyalty:
- Product fit. CX is not the only component of customer value. Companies that have tailored their products and services to better meet customers’needs (like USAA and TriCare) have an even better loyalty level than their CX would suggest. If companies have a poor product offering, then their loyalty may be lower than projected (this may explain Sears and DHL).
- Product quality. If companies have quality problems with their offerings, then they would have lower loyalty levels than their CX deserve (this may explain AT&T, T-Mobile, and Alamo).
- Service expectations. Companies that have premium status (BMW cars and Bosch appliances) often elicit higher expectations from customers, so they don’t earn the loyalty that their CX would suggest and have to work harder.
- Trapped customers. In industries where customers have a hard time switching, a bad experience may not lead to the loyalty decline anticipated by the model; the same type of situation would occur if a company is harder to move away from than it’s competitors (this may explain Medicaid, Medicare, MSN, and EarthLink).
- Commoditization. In industries that have a lot of pricing comparisons, customers may overly focus on price and not award good customer experience with the level of loyalty that the model projects (this may explain Alamo). It can also push consumers that have poor experience to more quickly leave a company for its competitor (this may explain DHL).
- Substitutions. In sitations where customers don’t have a lot of clear alternatives, they will be more loyal to a company than the model suggests (this may explain eBay). A company that relies on self-service may be seen as easier to move from than a company that forms more personal connections with customers (this may explain E*TRADE).
- Emotionality. Sometimes customers develop a strong affinity for a brand that increases loyalty and dampens the negative effect of any poor experiences (this may explain Southwest Airlines and Apple).
These items cover three broad topics: offerings, competitive environment and customer expectations. What do you think causes companies to earn more or less loyalty than their customer experience seems to deserve?
The bottom line: CX is correlated to loyalty, but other things matter as well
Filed under Customer experience, Customer loyalty, ROI of Customer Experience
Tagged with 21st Century, A credit union, AAA, Aetna, AirTran Airways, ALamo, Aldi, American Family, Apple, AT&T, BMW, Bosch, Cablevision, Cigna, Compaq, DHL, E*Trade, Earthlink, eBay, Ford, Hardees, Highmark, HSBC, Kaiser Permanente, Lenovo, Medicaid, Medicare, MSN, PNC, Sears, Southwest Airlines, T-Mobile, TD Bank, TracFone, TriCare, United Airlines, USAA, Virgin Mobile


