2017 Temkin Forgiveness Ratings, UK: Sony, Aldi, & Nationwide On Top

Every organization makes some mistakes, so an important area of loyalty is the willingness of customers to forgive them. That’s why Temkin Group has been measuring forgiveness for several years in the U.S.

This year we’re publishing the 2017 Temkin Forgiveness Ratings, UK, which evaluates 157 companies across 16 industries based on a survey of 5,000 UK consumers in January 2017 (see full list of companies below). At the top of the ratings are Sony, Aldi, and Nationwide. At the bottom of the list are Audi, Bank of Scotland, and Airbnb.

You can see a summary of the results in the charts below, and you can also purchase the dataset with 2017 Temkin Forgiveness Ratings, UK for all 157 companies. And it also includes industry average Temkin Forgiveness Ratings across age groups.

Download dataset for $295 (see sample file)

Read more of this post

Report: Employee Engagement Competency & Maturity, 2017

1706_StateOfEE2017_COVER2We just published a Temkin Group report, Employee Engagement Competency & Maturity, 2017. Here’s the executive summary of this annual review of employee engagement activities, competencies, and maturity levels for large companies:

Engaged employees are critical assets to their organization. It’s not surprising, therefore, that customer experience leaders have more engaged employees than their peers. To understand how companies are engaging their employees, we surveyed 169 large companies and compared their responses with similar studies we’ve conducted in previous years. We also asked survey respondents to complete Temkin Group’s Employee Engagement Competency & Maturity (EECM) Assessment. Highlights from our analysis of their responses include:

  • Front-line employees are viewed as the most highly engaged.
  • More than 70% of companies measure employee engagement at least annually, yet only 45% of executives consider taking action on the results a high priority.
  • Sixty-four percent of respondents believe that their social media tools have had a positive impact on their employee engagement activities, an increase from last year.
  • The top obstacle to employee engagement activities continues to be the lack of an employee engagement strategy.
  • While only 23% of companies are in the top two stages of employee engagement maturity, this is still an increase from last year.
  • When we compared companies with above average employee engagement maturity to those with lower maturity, we found that employee engagement leaders have better customer experience, enjoy better financial results, are more likely to take action on employee feedback, and face fewer obstacles than their counterparts with less engaged workforces.
  • You can use the results of the EECM Assessment to benchmark your own employee engagement activities.

Download report for $195+
BuyDownload3

Here’s an excerpt from one of the 17 graphics that shows the maturity levels of employee engagement efforts in large companies and their effectiveness across five employee engagement competencies:

Download report for $195+BuyDownload3

Report: What Happens After a Good or Bad Experience, 2017

We just published a Temkin Group report, What Happens After a Good or Bad Experience, 2017. This is our annual analysis of which companies deliver the most and least bad experiences, how consumers respond after those experience (in terms of sharing those experiences and changing their purchase behaviors), and the effect of service recovery (see last year’s report).

Here’s the executive summary:

To understand how good and bad experiences effect customer behavior, we asked 10,000 U.S. consumers about their recent interactions with more than 300 companies across 20 industries. We then compared results with similar studies we’ve conducted over the previous six years. Here are some highlights:

  • About 19% of the customers who interacted with Internet service providers and TV service providers reported having a bad experience – a considerably higher percentage than in other industries. Of the companies we evaluated, 21st Century, Spirit Airlines, and HSBC deliver bad experiences most frequently.
  • We looked at the percentage of customers in an industry had a bad experience and combined that number with the percentage of customers who said they decreased their spending after a bad experience and then used this data to create a Revenues at Risk Index for all 20 industries. Rental car agencies stand to lose the most revenue (6.7%) from delivering bad experiences, while retailers stand to lose the least (1%).
  • Investment firms are most effective at recovering after a bad experience, whereas TV service providers are the least effective.
  • After customers have a very bad or very good experience with a company, they are more likely to give feedback directly to the company than they are to post about it on Facebook, Twitter, or third party rating sites. Customers are also more likely to share positive feedback through online surveys and share negative feedback through emails.
  • Compared to previous years, customers are more likely to share feedback over Facebook and Twitter, and these channels are most popular with consumers who are between 25- and 44-years-old.
  • Of all the companies we evaluated, The Hartford is the most likely to receive negatively biased feedback directly from its customers, while Chubb is likely to receive the most positively biased feedback.

Download report for $195
BuyDownload3

Here are excerpted versions of 3 (out of 19) graphics in the report:
Read more of this post

2017 Temkin Forgiveness Ratings: Advantage Rent-A-Car and ACE Rent A Car on Top

We just published the 2017 Temkin Forgiveness Ratings. It uses feedback from 10,000 U.S. consumers to rate how likely consumers are to forgive  329 organizations across 20 industries (see full list of companies (.pdf)) after they make a mistake. You can see all of the company data on the Temkin Ratings website.

Every organization makes some mistakes, so an important area of loyalty is the willingness of customers to forgive them. That’s why Temkin Group has been measuring forgiveness for seven years.

Download dataset for $295 (see sample file)

Advantage Rent-A-CarACE Rent A Car, Navy Federal Credit Union, Fujitsu, Fox Rent A Car, AmazonFresh, Rent-a-Wreck, Alabama Power Company, Fairfield Inn, and USAA earned the top 10 spots.

At the other end of the spectrum, consumers are least likely to forgive Comcast, Time Warner Cable, Cox Communications, Anthem, Aetna, Cablevision, Travelers, Citigroup, Fifth Third, Bright House Networks, Spirit Airlines, and Dish Network.

Download dataset for $295 (see sample file)

Additional highlights of the 2017 Temkin Forgiveness Ratings:

Read more of this post

Report: 2017 Temkin Experience Ratings, UK

We just published a Temkin Group report, 2017 Temkin Experience Ratings, UK. This is the same customer experience benchmark that we’ve been publishing for U.S. firms over the past seven years.

The UK Temkin Experience Ratings is a cross-industry, open-standard benchmark of customer experience. To generate these scores, we asked 5,000 UK consumers to rate their recent interactions with 157 companies across 16 industries and then evaluated their experiences across three dimensions: success, effort, and emotion.

Here are some highlights from the research:

  • Co-op, M&S Food, and Lidl earned highest overall ratings, while Audi, BMW, and Flybe earned the lowest.
  • When we compared company ratings with their industry averages, we found that Saga, Premier Inn, Vauxhall, and Volkswagen most outperformed their peers, while Audi and Bank of Scotland fell well below their competitors.
  • Take a look at a listing of all 157 companies.

Download report and dataset for $295
(Report includes an Excel file with data for all 157 companies.
Download sample dataset to see what’s included)
BuyDownload3

Here are the top and bottom companies and the industry averages in the 2017 Temkin Experience Ratings, UK:

Download report and dataset for $295
(Report includes an Excel file with data for all 157 companies.
Download sample dataset to see what’s included)
BuyDownload3

Report: Employee Engagement Benchmark Study, 2017

We just published a Temkin Group report, Employee Engagement Benchmark Study, 2017. This is the sixth year that we’ve published the benchmark of U.S. employees. The research is based on an online survey on Q3 2016. (Take a look at our Employee Engagement Resource Page).

For the sixth year in a row, Temkin Group used the Temkin Employee Engagement Index to analyze the engagement levels of more than 5,000 U.S. employees. We found that:

  • Sixty-three percent of U.S. employees are “highly” or “moderately” engaged – the highest level we’ve seen in the six years we’ve conducted this study.
  • Companies that outperform their competitors in both financial results and customer experience have more engaged workers.
  • Compared to disengaged employees, highly engaged employees are almost five times more likely to recommend the company’s products and services, they are over four times more likely to do something that is good, yet unexpected, for the company, they are three times more likely to stay late at work if something need to be done, and they are over five times more likely to recommend an improvement at the company.
  • Companies with 501 to 1,000 employees have the highest percentage of engaged employees, while companies with 10,000 or more employees have the lowest.
  • On an individual level, our research shows that the most highly engaged employees tend to be those who regularly interact with customers, who are highly educated, who earn a high income, and who are executives.
  • Forty-nine percent of construction employees are highly engaged, the highest level of any industry. At the other end of the spectrum, only 20% of employees in public administration are highly engaged.
  • Given the significant value of engaged employees, we recommend that companies improve engagement levels by mastering our Five I’s of Employee Engagement: Inform, Inspire, Instruct, Involve, and Incent.

Download report for $195
BuyDownload3

Here’s what we found when we examined year-over-year results for the Temkin Employee Engagement Index:

Download report for $195
BuyDownload3

Here are previous employee engagement benchmark studies: 2016, 2015, 2014, 2013, 2012.

Report: 2017 Temkin Experience Ratings (U.S.)

1703_temkinexperienceratingsus_coverTemkin Ratings websiteWe published the 2017 Temkin Experience Ratings, the seventh annual release of this comprehensive customer experience benchmark. Here’s the executive summary:

2017 is the seventh straight year that we’ve published the Temkin Experience Ratings, a cross-industry, open standard benchmark of customer experience. To generate these Ratings, we asked 10,000 U.S. consumers to rate their recent interactions with 331 companies across 20 industries and then evaluated their experiences across three dimensions: success, effort, and emotion. Here are some highlights from this benchmark:

  • Publix, Chick-fil-A, and H-E-B earned the highest overall ratings, while Health Net, Blue Shield of CA, and Comcast earned the lowest scores.
  • When we compared company ratings with their industry averages, we found that Kaiser Permanente, Georgia Power, Advantage Rent-A-Car, and Regions most outperformed their peers, while Spirit Airlines and Days Inn feel farthest behind their competitors.
  • The Ratings saw its first general decline in 2015 and then dropped considerably in 2016. This year, however, the Ratings significantly increased, with only seven companies’ scores declining. Fujitsu, Volkswagen, Fairfield Inn, Columbia Natural Gas, and Advantage Rent-A-Car improved the most since last year.
  • To improve customer experience, companies need to master four competencies: Purposeful Leadership, Compelling Brand Values, Employee Engagement, and Customer Connectedness.

Industry Changes in the 2017 Temkin Experience Ratings

We used the same methodology for the Temkin Experience Ratings this year that we’ve used for all of the prior years. Every year, the companies in the Temkin Experience Ratings shift a bit, but this year we made some more substantive changes. Specifically, we:

  • Combined TV service and Internet service. While we have historically provided separate ratings for TV service providers and Internet service providers, we decided to combine those categories this year. It turns out that many of the companies are in both categories and many consumers purchase those services as a bundle.
  • Added streaming media. Given the rise of services such as NetFlix and Hulu, we added a new category that focuses on the customer experience of those streaming media companies.
  • Expanded some industries. We enlarged a number of categories to increase the number of relevant companies. We changed the appliance category to TV and appliances to include a larger group of consumer electronics providers. We also included some newer companies into existing categories. We updated rental cars to rental cars & transport so that we could include firms like Uber, and we changed hotels to hotels & rooms to include companies like Airbnb.

Download report for FreeFreeDownloadButton You can also download the dataset in Excel for $395

Have questions? See our FAQs about the Temkin Experience Ratings. We also have snapshots on all 20 industries.

Here’s a recording of a webinar where we discuss the 2017 Temkin Experience Ratings:

The Temkin Experience Ratings are based on evaluating three elements of experience:

  1. Success: How well do experiences meet customers’ needs?
  2. Effort: How easy is it for customers to do what they want to do?
  3. Emotion: How do customers feel about the experiences?

Here are the top and bottom companies in the ratings:1703_2017txrtopbottom

***See how your company can reference these results or
display a badge for top 10% and industry leaders***

Read more of this post

Report: State of the CX Profession, 2017

1702_stateofcx-profession2017_coverWe just published a Temkin Group report, State of the CX Profession, 2017. This is the fifth year that we’ve examined the roles of CX professionals and the third year that we’ve done a compensation study. Here’s the executive summary:

To understand the mindset and roles of customer experience professionals today, we surveyed 237 CX professionals and then compared their responses to similar studies we’ve conducted over the previous five years. We asked them how their CX efforts impacted their organization last year and about their plans for the coming year. This report also includes a compensation study, which is based on the 158 respondents who agreed to participate. Here are some highlights from the research:

  • Eighty-four percent of respondents say that their customer experience efforts have had a positive business impact in 2016.
  • Ninety-nine percent think that customer experience is a great profession to be in, the highest level we’ve seen in the six years we’ve been doing the study.
  • Eighty percent think that customer experience will be more important for their companies in 2017 than it was in 2016, compared to the 3% who think it will be less important.
  • Forty-nine percent expect to see an increase in their customer experience staffing levels this year – a higher percentage than we’ve seen in previous years.
  • Respondents plan to increase their spending most on voice of the customer software and text analytics.
  • Respondents plan to increase their focus most on Web experiences and customer insights and analysis.
  • The total amount of compensation in our study ranges from $93,000 for mid-level individual contributors to $239,000 for CX executives.

1602_DontBuyReportJoinCXPA

Download report for $195
BuyDownload3

Here’s some data that combines pieces of two graphic, showing that CX continues to be a great profession….

1702_cxprofessionalssummary

Download report for $195
BuyDownload3

The bottom line: The CX profession is thriving.

Report: Tech Vendors: Product and Relationship Satisfaction, 2017

1701_ds_techproductsandrelationships_coverWe just published a Temkin Group data snapshot, Tech Vendors: Product and Relationship Satisfaction of IT Clients, 2017.

During Q3 of 2016, we surveyed 800 IT decision-makers from companies with at least $250 million in annual revenues, asking them to rate both the products of and their relationships with 62 different tech vendors. HPE outsourcing, Google, and IBM SPSS earned the top overall scores, while Trend Micro, Infosys, and SunGard received the lowest overall scores. To determine their product rating, we evaluated tech vendors across four product/service criteria: features, quality, flexibility, and ease of use. And we calculated their relationship rating using four different criteria: technical support, support of the account team, cost of ownership, and innovation of company. We also looked at how the average product and relationship scores of tech vendors have changed over the previous three years.

This research has a report (.pdf) and a dataset (excel). The dataset has the details of Product/Service and Relationship satisfaction for the 62 tech vendors as well as for several tech vendors with sample sizes too small to be included in the published report.

Download report for $495
(includes Excel spreadsheet with data)
BuyDownload3

Here’s a link to last year’s study.

The research examines eight areas of satisfaction; four that deal with products & services and four that examine relationships. Tech vendors earned the highest average satisfaction level for product features (64%) and the lowest for total cost of ownership (57%).

As you can see in the chart below, the overall product/service & relationship satisfaction ranges from a high of 76% for HPE outsourcing down to a low of 42% for Trend Micro.

1701_techproductrelationshipoverallresults

Read more of this post

Report: The State of CX Metrics, 2016

1612_stateofcxmetrics2016_coverWe published a Temkin Group report, The State of CX Metrics, 2016. This is the sixth year of this study that examines the CX metrics efforts within large companies. Here’s the executive summary:

Temkin Group surveyed 183 companies to learn about how they use customer experience (CX) metrics and then compared their answers with similar studies we’ve conducted every year since 2011. We found that the most commonly used metrics continue to be likelihood-to-recommend and satisfaction, while the most successful metric is transactional interaction satisfaction. Only 10% of companies regularly consider the effect of CX metrics when they make day-to-day decisions. The top two problems companies face are limited visibility of CX metrics and the lack of taking action on metrics. Companies are best at measuring customer service and phone-based experiences and are worst at measuring the experiences of prospects and customers who defect. We also had companies complete Temkin Group’s CX Metrics Program Assessment, which examines four characteristics of a metrics program: consistent (does the company use common CX metrics across the organization?), impactful (do the CX metrics inform important decisions?), integrated (are trade-offs made between CX and financial metrics?), and continuous (do leaders regularly examine the CX metrics?). Only 11% of respondents received at least a “good” overall rating in this assessment, and companies earned the lowest average rating in integrated. Companies with stronger CX metrics programs deliver better customer experience and use more effort and likelihood-to-repurchase metrics.

See the State of CX Metrics studies from 2011, 201220132014, and 2015.

Download report for $195
BuyDownload3

Here are the results form our CX Metrics Competency & Maturity Assessment (one of 22 graphics in the report):

1612_cxmetricsmaturity

Download report for $195
BuyDownload3

Tech Vendor Client Success Ratings, 2016

Are tech vendors helpful in making their IT clients successful? To answer that question, we surveyed 800 IT decision makers from North American companies with at least $250 million in annual revenues.

We asked the following question:

How helpful are these IT vendors in making sure that your organization successfully achieves its desired value from the products and services that you have purchased from them?

Responses are on a scale from 1 (not at all helpful) to 7 (extremely helpful).1611_clientsuccessratingsTemkin Group created the Client Success Ratings (CSR), which is the percentage of respondents who answered 6 or 7.  As you can see below, the average CSR is 63%, which is an increase from 61% last year.

1612_techvendorsuccessoverall2yrs

Which tech vendors are the best and the worst? We examined client responses for 62 tech vendors and found that IBM software, Google, IBM SPSS, VMware, and HPE outsourcing have the highest CSR. At the other end of the spectrum, Trend Micro, Accenture outsourcing, Sun Microsystems, and Satyam have the lowest CSR.

1612_techvendorsuccessblocked

You can purchase and download the dataset for $295.BuyDownloadThe dataset includes the detailed client success ratings for the 62 tech vendors listed in the graphic above, along with the results from 2015.

Report: Temkin Loyalty Index, 2016

1611_temkinloyaltyindex_coverWe published a Temkin Group report, Temkin Loyalty Index, 2016. This is the second year of this study that examines the loyalty of U.S. consumers to 294 companies across 20 industries. Here’s the executive summary:

The 2016 Temkin Loyalty Index (TLi) evaluates how loyal 10,000 U.S. consumers feel towards 294 companies across 20 industries. To determine companies’ TLi, we asked respondents to rate how likely they are to exhibit five loyalty-related behaviors: repurchasing from the company, recommending the company to others, forgiving the company if it makes a mistake, trusting the company, and trying the company’s new offerings. Our research shows that, of all the companies we looked at, customers feel the most loyal towards Publix, USAA, and H-E-B, and feel the least loyal towards Comcast, Motel 6, and Anthem. At the industry level, we found that supermarkets, hotels, and retailers inspire the highest levels of loyalty, while TV service providers and Internet service providers trigger the lowest levels. Meanwhile, USAA, Mercedes-Benz, and Alabama Power Company enjoy the highest levels of customer loyalty compared with their industry peers, whereas Motel 6, Citibank, and Compaq fall the furthest behind their industry peers. We also compared the results of this year’s Index with those from last year and found that the average TLi declined across all 20 industries. TV service providers declined the most, while banks declined the least. And when we narrowed in on each of the five loyalty behaviors, we found that the Trust component scores dropped most significantly. And while the vast majority of individual companies’ TLi decreased over the past year, both Con Edison of NY and Morgan Stanley Smith Barney saw their scores improve by more than nine points.

Here’s the 2015 Temkin Loyalty Index.

Download report for $295
(Includes report plus dataset in Excel. See sample spreadsheet (.xls))
BuyDownload3

Temkin Group’s TLi is based on evaluating consumers’ likelihood to do these five things (data for these items are included in the dataset):

  • Repurchase from the company
  • Recommend the company to others
  • Forgive the company if it makes a mistake
  • Trust the company
  • Try new offerings from the company

Here are the top and bottom rated companies:

1611_tli_topbottomcompanies

Read more of this post

Report: 2016 Temkin Experience Ratings of Tech Vendors

1610_temkinexperienceratingstechvendors_coverWe just published a Temkin Group report 2016 Temkin Experience Ratings of Tech Vendors that rates the customer experience of 62 large tech vendors based on a survey of 800 IT decision makers from large North American firms. This is the fifth year of the ratings, here are links to the 2012, 20132014, and 2015 ratings.

Here is the executive summary of the report:

The 2016 Temkin Experience Ratings of Tech Vendors evaluates the customer experience of 62 large technology vendors. We surveyed 800 IT decision-makers from large companies regarding three components – success, effort, and emotion – of their experiences with these IT providers. Out of all the vendors we looked at, HPE outsourcing, IBM SPSS, and Google earned the highest ratings, while Capgemini, Infosys, and Accenture received the lowest ratings. The average score for the Ratings dropped by one percentage-point over the past year, down from 59% in 2015 to 58% this year. Furthermore, our research shows that the Temkin Experience Ratings are strongly correlated with multiple elements of loyalty behavior, including likelihood of repurchasing from the company, likelihood of recommending the company, likelihood of trying new products, and likelihood of forgiving the company if it makes a mistake.

This product has a report (.pdf) and a dataset (excel). The dataset has the details of the 2016 Temkin Experience Ratings, including all three components, for the 62 tech vendors as well as data on customers’ likelihood to repurchase from the vendors, their 2016 Temkin Forgiveness Ratings, and their 2016 Temkin Innovation Equity Quotient. It also includes a summary of the 2015 Temkin Experience Ratings, likelihood to repurchase, and Temkin Forgiveness Ratings.

Download for $695, includes report (.pdf) and data file (.xls)
BuyDownload3

The Temkin Experience Ratings of Tech Vendors evaluates three areas of customer experience: success (can customers achieve what they want to do), effort (how easy is it for customers to do what they want to do), and emotion (how do customers feel about their interaction). Here are the overall results:

1610_techvendortxr_companies

Read more of this post

Report: State of Voice of the Customer Programs, 2016

1610_stateofvocprograms2016_coverWe published a Temkin Group report, State of Voice of the Customer Programs, 2016. This is the sixth year that we’ve benchmarked the competency & maturity of voice of the customer programs within large organization. Here’s the executive summary:

For the sixth straight year, Temkin Group has benchmarked the competency and maturity levels of voice of the customer (VoC) programs within large organizations. We found that while most companies think that their VoC efforts are successful, less than one-third of companies actually consider themselves good at reviewing implications that cut across the organization. Respondents think that in the future, the most important source of insights will be customer interaction history and the least important source will be multiple-choice questions. And although respondents believe that technology will play an increasingly important role in their VoC efforts, they also cite “integration across systems” as the biggest obstacle to their VoC success, and this concern has only grown in the past year. In addition to asking questions about their VoC program, we also had respondents complete Temkin Group’s VoC Competency and Maturity Assessment, which examines capabilities across what we call the “Six Ds”: Detect, Disseminate, Diagnose, Discuss, Design, and Deploy. Only 16% of companies have reached the two highest levels of VoC maturity, while 43% remain in the bottom two levels. When we compared higher-scoring VoC programs with lower-scoring programs, we found that companies with mature programs are more successful, they focus more on analytics, and they have more full-time staff, more strongly coordinated efforts, and more involved senior executives.

See the State of VoC reports from 2010201120132014, and 2015.

Download report for $195
BuyDownload3

Here are the results from Temkin Group’s VoC Competency & Maturity Assessment:

1610_vocmaturity

Download report for $195
BuyDownload3

Report: Net Promoter Score Benchmark Study, 2016

1610_npsbenchmarkstudy_coverWe published a Temkin Group report, Net Promoter Score Benchmark Study, 2016. This is the fifth year of this study that includes Net Promoter® Scores (NPS®) on 315 companies across 20 industries based on a study of 10,000 U.S. consumers. Here’s the executive summary:

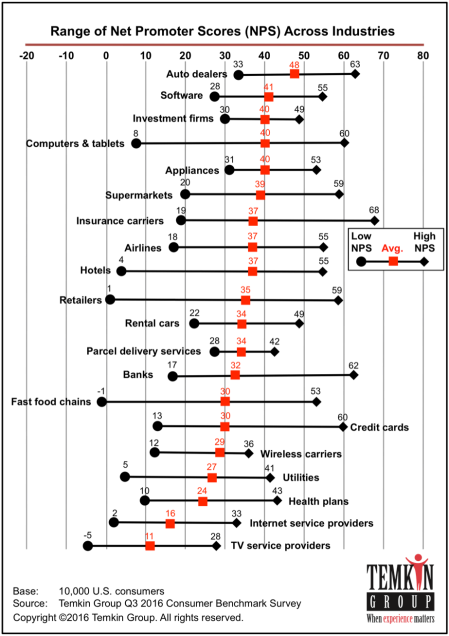
As many large companies use Net Promoter® Score (NPS) to evaluate their customer loyalty, Temkin Group measured the NPS of 315 companies across 20 industries. With an NPS of 68, USAA’s insurance business earned the highest score in the study for the fourth year in a row. Four other companies also earned an NPS of 60 or higher: Cadillac, USAA’s banking business, Apple, and USAA’s credit card business. In addition to earning some of the top scores, USAA’s banking, credit card, and insurance businesses also all outpaced their respective industries’ averages by more than any other company. Comcast, meanwhile, earned the lowest NPS for the second year in a row, coming in just below Time Warner Cable, Cox Communications, and McDonalds. And while all 20 industries increased their average NPS from last year, utilities enjoyed the biggest improvement in its score. Out of all the companies, US Airways’s and Advantage Rent-A-Car’s scores improved the most, whereas TriCare’s and Lexus’s scores declined the most. On average across the industries, the youngest consumers gave companies the lowest NPS, while 35- to 44-year-olds gave them the highest NPS.

See the NPS Benchmark Studies from 2012, 20132014, and 2015.

Here’s a list of companies included in this study (.pdf).

Download report for $495
(includes report (in .pdf) plus dataset in Excel)
BuyDownload3

Here are the NPS scores across 20 industries:
1610_rangeofindustrynps

Here are some other highlights of the research:

  • Five industries toped the list with an average NPS of 40 or more: auto dealers, software, investments, computers & tablets, and appliances.
  • The bottom scoring industries are TV service providers, Internet service providers, and health plans.
  • USAA’s insurance, banking, and credit card businesses earned NPS levels that are 30 or more points above their industry averages. Five other firms are 20 or more points above their peers: com, credit unions, Chick-fil-A, Apple, and Trader Joe’s.
  • Five companies fell 25 or more points below their industry averages: RadioShack, Motel 6, eMachines, McDonalds, and Days Inn.
  • US Airway’s NPS increased by 31 points between 2015 and 2016, the largest increase of any company. Eight other companies improved by 25 or more points: Fifth Third, 21st Century, Fujitsu, DHL, MetLife, HSBC, Commonwealth Edison, PSE&G, and Hannaford.
  • TriCare, Lexus, Mercedes-Benz, Baskin Robins, and Nordstrom had double-digit declines in NPS between 2015 and 2016.

Download report for $495
(includes report (in .pdf) plus dataset in Excel)
BuyDownload3

If you want to know what data is included in this report and dataset, download this sample Excel dataset file.Screen Shot 2014-10-17 at 4.05.17 PM

P.S. Net Promoter Score, Net Promoter, and NPS are registered trademarks of Bain & Company, Satmetrix Systems, and Fred Reichheld.