Report: Tech Vendors: Product and Relationship Satisfaction, 2017

1701_ds_techproductsandrelationships_coverWe just published a Temkin Group data snapshot, Tech Vendors: Product and Relationship Satisfaction of IT Clients, 2017.

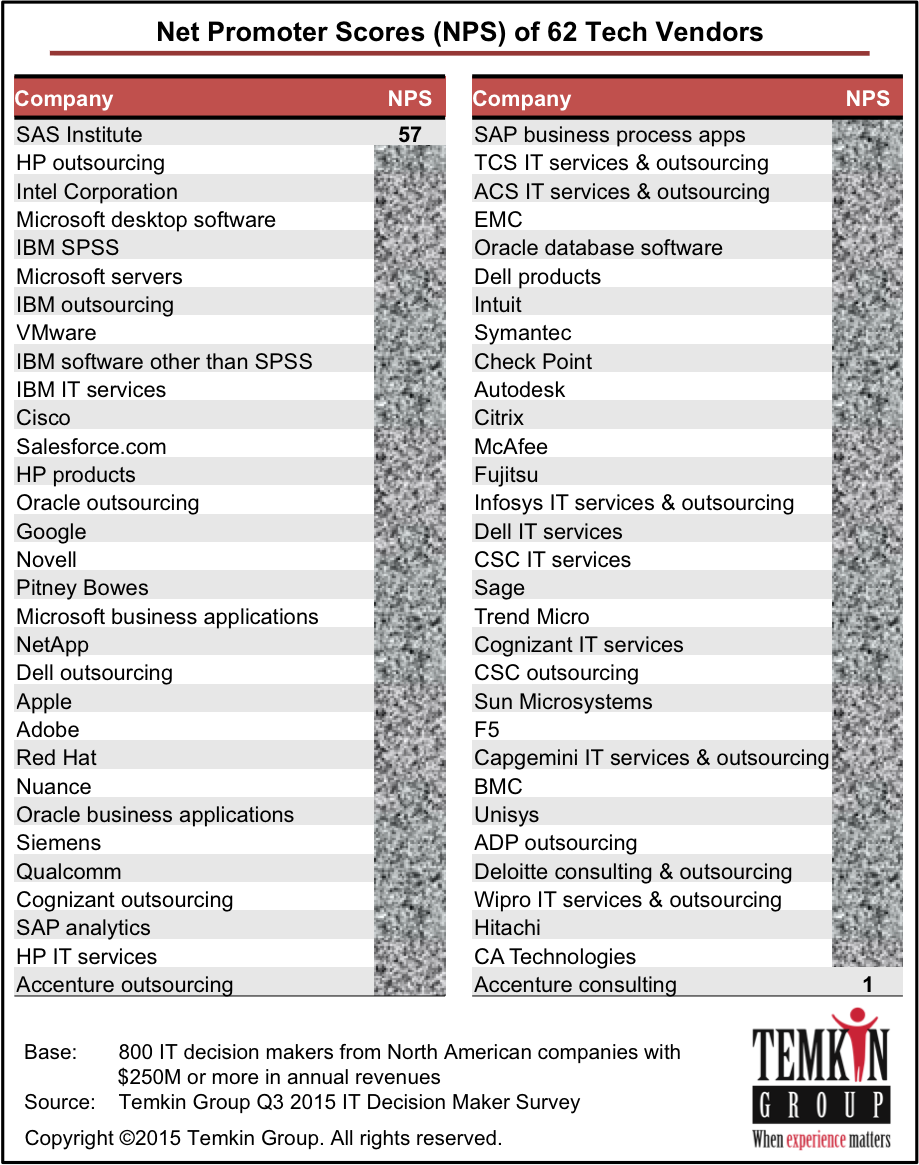
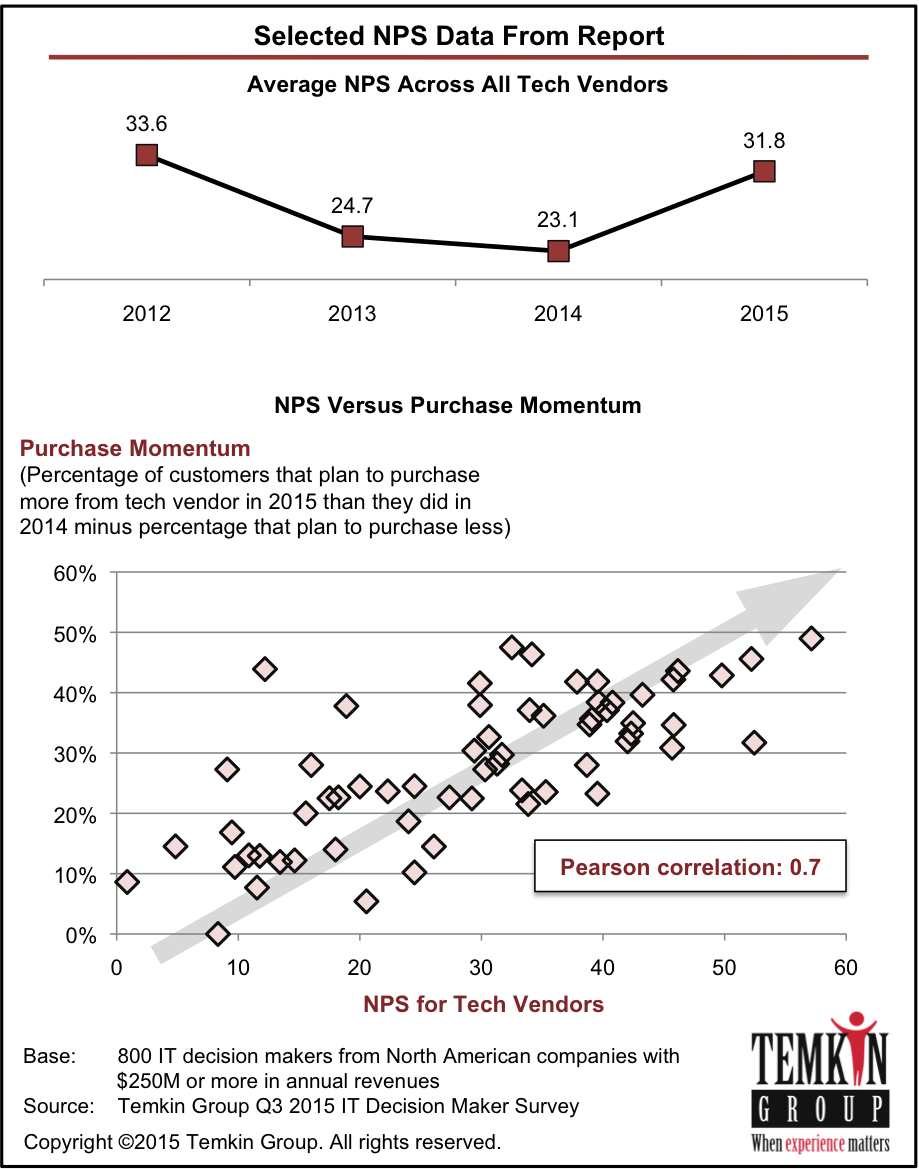
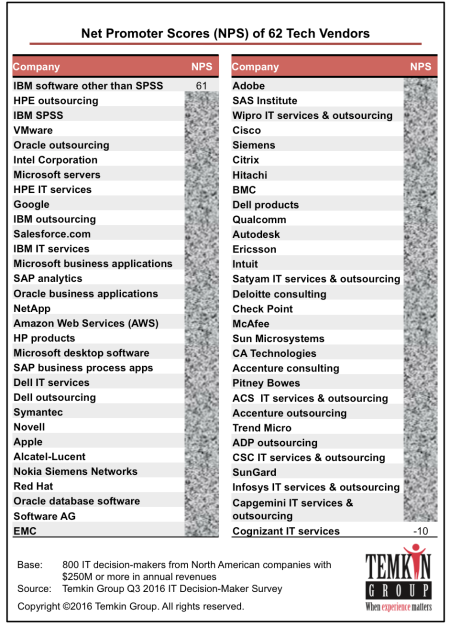
During Q3 of 2016, we surveyed 800 IT decision-makers from companies with at least $250 million in annual revenues, asking them to rate both the products of and their relationships with 62 different tech vendors. HPE outsourcing, Google, and IBM SPSS earned the top overall scores, while Trend Micro, Infosys, and SunGard received the lowest overall scores. To determine their product rating, we evaluated tech vendors across four product/service criteria: features, quality, flexibility, and ease of use. And we calculated their relationship rating using four different criteria: technical support, support of the account team, cost of ownership, and innovation of company. We also looked at how the average product and relationship scores of tech vendors have changed over the previous three years.

This research has a report (.pdf) and a dataset (excel). The dataset has the details of Product/Service and Relationship satisfaction for the 62 tech vendors as well as for several tech vendors with sample sizes too small to be included in the published report.

Download report for $495
(includes Excel spreadsheet with data)
BuyDownload3

Here’s a link to last year’s study.

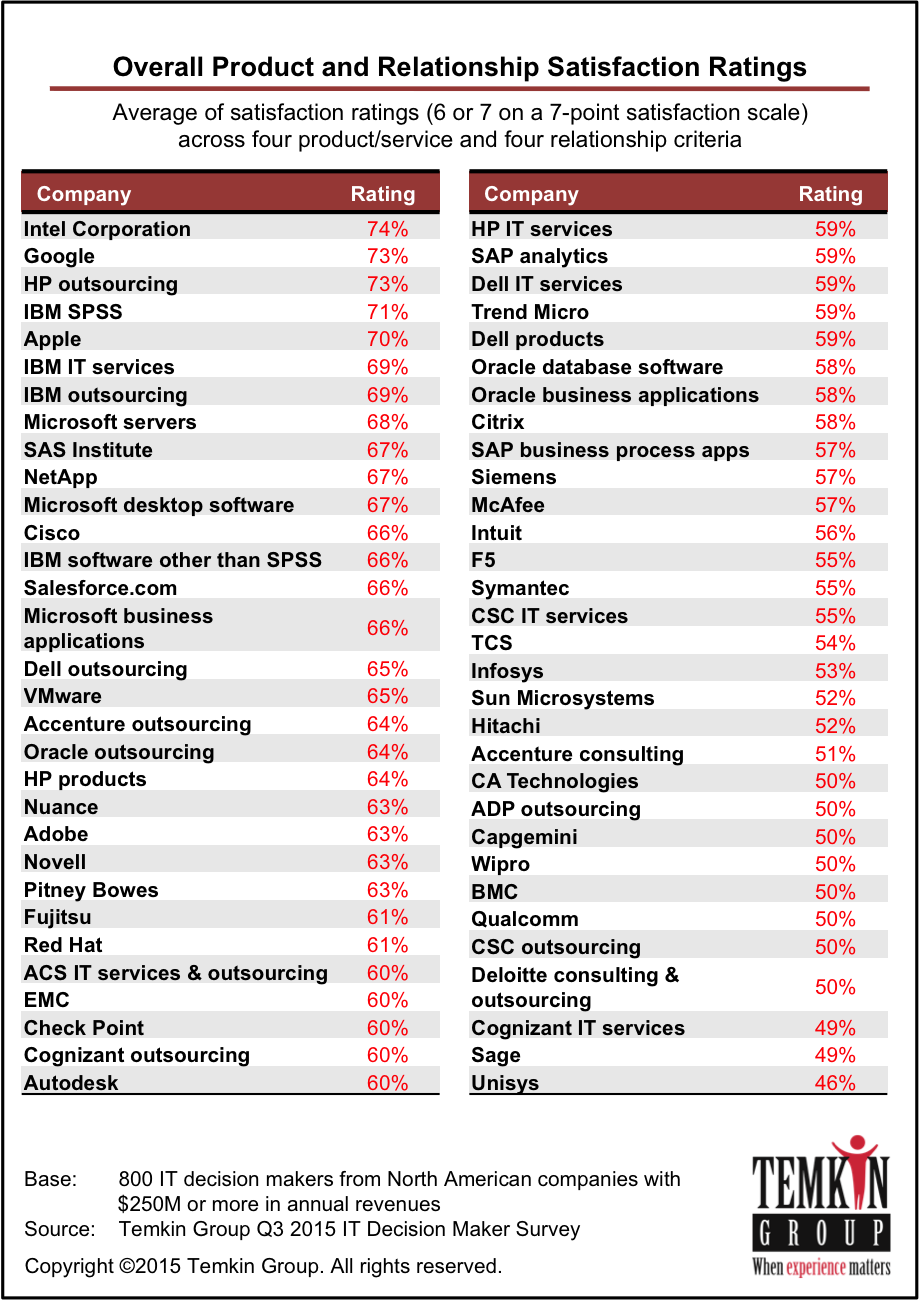
The research examines eight areas of satisfaction; four that deal with products & services and four that examine relationships. Tech vendors earned the highest average satisfaction level for product features (64%) and the lowest for total cost of ownership (57%).

As you can see in the chart below, the overall product/service & relationship satisfaction ranges from a high of 76% for HPE outsourcing down to a low of 42% for Trend Micro.

1701_techproductrelationshipoverallresults

Read more of this post

Report: The State of CX Metrics, 2016

1612_stateofcxmetrics2016_coverWe published a Temkin Group report, The State of CX Metrics, 2016. This is the sixth year of this study that examines the CX metrics efforts within large companies. Here’s the executive summary:

Temkin Group surveyed 183 companies to learn about how they use customer experience (CX) metrics and then compared their answers with similar studies we’ve conducted every year since 2011. We found that the most commonly used metrics continue to be likelihood-to-recommend and satisfaction, while the most successful metric is transactional interaction satisfaction. Only 10% of companies regularly consider the effect of CX metrics when they make day-to-day decisions. The top two problems companies face are limited visibility of CX metrics and the lack of taking action on metrics. Companies are best at measuring customer service and phone-based experiences and are worst at measuring the experiences of prospects and customers who defect. We also had companies complete Temkin Group’s CX Metrics Program Assessment, which examines four characteristics of a metrics program: consistent (does the company use common CX metrics across the organization?), impactful (do the CX metrics inform important decisions?), integrated (are trade-offs made between CX and financial metrics?), and continuous (do leaders regularly examine the CX metrics?). Only 11% of respondents received at least a “good” overall rating in this assessment, and companies earned the lowest average rating in integrated. Companies with stronger CX metrics programs deliver better customer experience and use more effort and likelihood-to-repurchase metrics.

See the State of CX Metrics studies from 2011, 201220132014, and 2015.

Download report for $195
BuyDownload3

Here are the results form our CX Metrics Competency & Maturity Assessment (one of 22 graphics in the report):

1612_cxmetricsmaturity

Download report for $195
BuyDownload3

Report: ROI of Customer Experience, 2016

1610_roiofcx_coverWe published a Temkin Group report, ROI of Customer Experience, 2016. This research shows that CX is highly correlated to loyalty across 20 industries. Here’s the executive summary:

To understand the connection between customer experience (CX) and loyalty, we examined feedback from 10,000 U.S. consumers that describes both their experiences with and their loyalty to different companies. To examine the CX component, we used the 2016 Temkin Experience Ratings (TxR), which evaluated 294 companies. Our analysis shows that there’s a very large correlation between companies’ TxR and the willingness of customers to purchase more from them. This connection holds true for other areas of customer loyalty as well. We used this data to calculate the revenue impact of CX across 20 industries. We found that a moderate increase in CX generates an average revenue increase of $823 million over three years for a company with $1 billion in annual revenues. Rental car agencies have the most to gain from improving CX ($967 million), while utilities have the least to gain ($645 million). While all three components of customer experience¬—success, effort, and emotion—have a strong effect on loyalty, our research shows that emotion is the most important element. When compared with companies with very poor CX, companies with very good CX have a 16.7 percentage-point advantage in customers who are willing to purchase more from them, 16.7 percentage-point advantage in customers who trust them, 10.3 percentage-point advantage in customers willing to forgive them if they make a mistake, and 7.1 percentage-point advantage in customers who are willing to try their new products. Additionally, companies with very good CX ratings have an average Net Promoter Score that is 22 points higher than the scores of companies with poor CX. We recommend that you build your own CX ROI models, using our five-step approach for guidance.

Download report for $295
BuyDownload3

This is one of the figures in the report, and it shows the high correlation between Temkin Experience Ratings (customer experience) and purchase intentions for 294 companies across 20 industries:
1610_purchasemorecorrelationgraphHere’s an excerpt from the graphic showing the three year impact on revenues for a $1 billion company in 20 different industries:

1610_roirevsbyindustry

Download report for $295
BuyDownload3

To see the customer experience levels of all 294 companies, download to the free 2016 Temkin Experience Ratings report.

P.S. Net Promoter Score, Net Promoter, and NPS are registered trademarks of Bain & Company, Satmetrix Systems, and Fred Reichheld.

Report: Net Promoter Score Benchmark Study, 2016

1610_npsbenchmarkstudy_coverWe published a Temkin Group report, Net Promoter Score Benchmark Study, 2016. This is the fifth year of this study that includes Net Promoter® Scores (NPS®) on 315 companies across 20 industries based on a study of 10,000 U.S. consumers. Here’s the executive summary:

As many large companies use Net Promoter® Score (NPS) to evaluate their customer loyalty, Temkin Group measured the NPS of 315 companies across 20 industries. With an NPS of 68, USAA’s insurance business earned the highest score in the study for the fourth year in a row. Four other companies also earned an NPS of 60 or higher: Cadillac, USAA’s banking business, Apple, and USAA’s credit card business. In addition to earning some of the top scores, USAA’s banking, credit card, and insurance businesses also all outpaced their respective industries’ averages by more than any other company. Comcast, meanwhile, earned the lowest NPS for the second year in a row, coming in just below Time Warner Cable, Cox Communications, and McDonalds. And while all 20 industries increased their average NPS from last year, utilities enjoyed the biggest improvement in its score. Out of all the companies, US Airways’s and Advantage Rent-A-Car’s scores improved the most, whereas TriCare’s and Lexus’s scores declined the most. On average across the industries, the youngest consumers gave companies the lowest NPS, while 35- to 44-year-olds gave them the highest NPS.

See the NPS Benchmark Studies from 2012, 20132014, and 2015.

Here’s a list of companies included in this study (.pdf).

Download report for $495
(includes report (in .pdf) plus dataset in Excel)
BuyDownload3

Here are the NPS scores across 20 industries:
1610_rangeofindustrynps

Here are some other highlights of the research:

  • Five industries toped the list with an average NPS of 40 or more: auto dealers, software, investments, computers & tablets, and appliances.
  • The bottom scoring industries are TV service providers, Internet service providers, and health plans.
  • USAA’s insurance, banking, and credit card businesses earned NPS levels that are 30 or more points above their industry averages. Five other firms are 20 or more points above their peers: com, credit unions, Chick-fil-A, Apple, and Trader Joe’s.
  • Five companies fell 25 or more points below their industry averages: RadioShack, Motel 6, eMachines, McDonalds, and Days Inn.
  • US Airway’s NPS increased by 31 points between 2015 and 2016, the largest increase of any company. Eight other companies improved by 25 or more points: Fifth Third, 21st Century, Fujitsu, DHL, MetLife, HSBC, Commonwealth Edison, PSE&G, and Hannaford.
  • TriCare, Lexus, Mercedes-Benz, Baskin Robins, and Nordstrom had double-digit declines in NPS between 2015 and 2016.

Download report for $495
(includes report (in .pdf) plus dataset in Excel)
BuyDownload3

If you want to know what data is included in this report and dataset, download this sample Excel dataset file.Screen Shot 2014-10-17 at 4.05.17 PM

P.S. Net Promoter Score, Net Promoter, and NPS are registered trademarks of Bain & Company, Satmetrix Systems, and Fred Reichheld.

Report: Tech Vendor NPS Benchmark, 2016 (B2B)

1609_technpsbenchmark_coverWe just published a Temkin Group report, Tech Vendor NPS Benchmark, 2016, The research examines Net Promoter Scores and the link to loyalty for 62 tech vendors based on feedback from 800 IT decision makers in large North American organizations. We also compared overall results to our benchmarks from the previous four years. Here’s the executive summary:

For the fifth year in a row, we examined the link between Net Promoter Scores® (NPS®) and loyalty for technology vendors. We surveyed 800 IT decision-makers from large North American firms to learn about their relationships with their technology providers. Of the 62 tech vendors we evaluated, IBM, HPE outsourcing, IBM SPSS, and VMware earned the highest NPS, while Cognizant, Capgemini, and Infosys received the lowest. Overall, the average NPS for the tech vendor industry decreased by almost 2 percentage points from last year. Our analysis shows that promoters are much more likely than detractors to increase their spending with tech vendors, try new products and services when they are announced, and forgive tech vendors after a bad experience. We also found that Software AG and HPE outsourcing are the top companies for purchase momentum, while IBM SPSS, IBM software, and IBM outsourcing have the highest Temkin Innovation Equity Quotient, and HPE outsourcing and IBM SPSS are at the top of the Temkin Forgiveness Ratings.

The report includes graphics with data for NPS, purchase intentions, likelihood to forgive, and likelihood to try a new offering. The excel spreadsheet includes this data (in more detail) for the 62 companies as well as for other tech vendors with less than 40 pieces of feedback. It also includes the summary NPS scores from 2015.

Download report for $695
(includes Excel spreadsheet with data)
BuyDownload3

As you can see in the chart below, the NPS ranges from a high of 61 for IBM software down to  a low of -10 for Cognizant IT services.

1609_techvendornpsclear

The industry average NPS decreased to 29.9 this year. The research also includes data for Purchase Momentum (how much customers are planning to buy), Temkin Forgiveness Ratings (likelihood of customers to forgive after a bad experience), and Temkin Innovation Equity Quotient (likelihood of customer to try a new offering). We not only list the results for each company, but we also show that NPS is highly correlated to each of these items (as you can see below for Purchase Momentum).

1609_techvendornpstrendandcorrelatoin

Report details: When you purchase this research, you will receive a written report and an excel spreadsheet with more data. The report includes graphics with data for NPS, purchase momentum, Temkin Forgiveness Ratings, and Temkin Innovation Equity Quotient for the 62 tech vendors that had at least 40 pieces of feedback. The excel spreadsheet includes this data (in more detail) for the 62 companies as well as for other tech vendors with less than 40 pieces of feedback. It also includes the summary NPS scores from 2015. If you want to know more about the data file, download this SAMPLE SPREADSHEET without the data (.xls).

Download report for $695
(includes Excel spreadsheet with data)
BuyDownload3

Note: See our 2015 NPS benchmark2014 NPS benchmark2013 NPS benchmark and 2012 NPS benchmark for tech vendors as well as our page full of NPS resources.

P.S. Net Promoter Score, Net Promoter, and NPS are registered trademarks of Bain & Company, Satmetrix Systems, and Fred Reichheld.

My Latest 9 Recommendations For NPS

We study 100’s of companies that use Net Promoter® Score (NPS®) and work with dozens of others that are in different stages of NPS deployment. We also publish one of the most comprehensive annual NPS benchmark studies. This gives us a unique view on how organizations use this popular customer experience metric.

Every year or so, after being asked a series of similar questions about NPS, I write a blog post with a collection of my thoughts. Before I get to my current thinking (which has remained relatively consistent over the years), here are some previous posts you might be interested in reading:

As you probably know, there are people who love NPS and people who hate it. I am neither. I’ve seen NPS used as an effective metric to drive change, and I’ve seen it used in ways that are harming organizations. I could also say that about almost every metric that I’ve seen being used.

Having established all of that, here are nine of my current recommendations:

  1. The choice of metric is not as important as people think. We rarely see a company succeed or fail based on the specific metric that it choses. That doesn’t mean that you can chose a ridiculous metric, but most reasonable metrics provide the same potential for success (and failure). In general, NPS is a reasonable metric to chose, as our data shows that it often correlates to customer loyalty. As organizations mature, we try to get them to use metrics that are more closely aligned to their brand promises.
  2. Driving improvements is what’s critical. Instead of obsessing about the specific metric being used, companies need to obsess about the system they put in place to make changes based on what they learn from using the metric. Successful NPS programs systematically take action on insights they uncover. If the program is working well, then the company isn’t debating scores. Instead, they’re continuously making changes to create more promoters and eliminate detractors.
  3. Promoters & detractors need their individual attention. The most important thing you can do with NPS is to understanding what is driving NPS. It turns out that the things that create promoters are not just the opposite side of the issues that create detractors. So you need to separately identify changes to create promoters and decrease detractors. All too often, companies focus just on detractors. This helps to fix problems, but it does not identify opportunities to propel your organization. By focusing on what causes promoters, you will get the opportunity to engage the organization in uplifting discussions—instead of just beating the drum about what’s broken.
  4. Sampling patterns really, really matter. The approach for sampling often has a very significant impact on NPS results (and results from other metrics as well). If you have multiple segments of customers and they each have a different NPS profile (as many do), then your overall NPS can change wildly based on the mix of those customers that are included in the NPS calculation. In B2B, this may come from combining results from enterprise accounts with smaller clients, or mixing responses from executive decision makers and end users of your products. In B2C, the variance may come form mixing data between new customers and repeat customers.
  5. NPS is for relationships, not transactions. Asking people if they would recommend a company isn’t a good question to use after an interaction. If a customer is a detractor on an NPS survey deployed right after a call into the contact center, for instance, then it doesn’t necessarily mean that there was a problem with that interaction. The contact center might have done a great job on the call, but the customer may still dislike something else about the company. If the contact center interaction had been problematic, then the customer’s NPS score might be temporarily lowered and not reflective of the customer’s longer-term view of the company.
  6. NPS is for teams, not individuals. Since NPS asks about the likelihood to recommend a company, it actually reflects the actions of more than one person. So if you want to look for someone to hold responsible for NPS results, think about making it a shared metric across a large group, not an individual KPI. Many companies that fall in love with NPS, start applying it to every part of their business, trying to give everyone their own NPS. While it’s worthwhile to look for improvements across the business based on NPS, you run into problems when you try to create to many levels of NPS.
  7. Compensation can be a real problem. When an organization shares a common metric (like NPS) and its people collectively have some compensation tied to it, then it can help align everyone’s focus on customer experience. But if the compensation gets too significant, then people start focusing too much on the number—questioning its validity and strong-arming customers—instead of looking for ways to make improvements. Remember, the majority of your discussions should be about making improvements, not data.
  8. Target ranges make more sense than single numbers. NPS is an inherently jittery metric; there’s only a porous line keeping passives from becoming promoters or detractors. And the situation is magnified by the sampling issues described above. That’s why we see many customer insights group wasting a lot of time running around trying to explain small movements in their companies’ NPS, as executives overreact to small movements. Instead of setting NPS goals as a specific number, consider defining a range (similar to a process control chart). As a start, think about adopting a 3- to 5-point range. That way you only react to results outside of the range or multiple periods of increases or declines.
  9. There are four loops to close. When people talk about closed loop and NPS, they often mean contacting customers after they answer the NPS question. But that immediate response is just one what we call the four customer insight-driven action loops: Immediate response, corrective action, continuous improvement, and strategic change. Any NPS program should put in places processes to close all four loops.

The bottom line: NPS success comes from the process, not the metric.

Net Promoter Score, Net Promoter, and NPS are registered trademarks of Bain & Company, Satmetrix Systems, and Fred Reichheld.

Use Customer Insights To Close Four Loops

Companies that have voice of the customer (VoC) programs (including NPS) often put in place a closed-loop process. Those efforts often focus on closing a single loop, immediately responding to a customer after they respond to a survey. But this represents only one of four loops that companies need to close.

In the report, Make Your VoC Action-Oriented, we introduced the concept of four closed loops.

1608_FourActionLoops
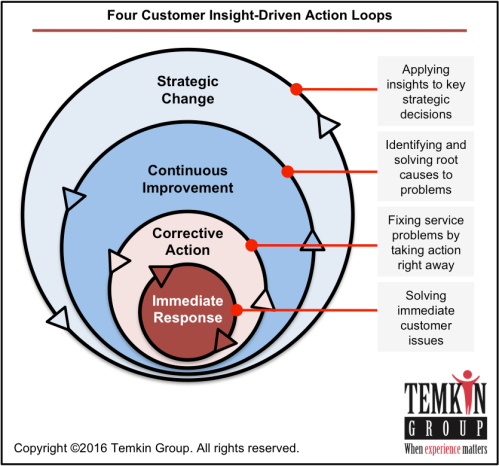
Here’s an example of the four loops for a restaurant chain:

  • Immediate Response. Reach out to a restaurant customer who responded on a survey that the bathroom was dirty and help take care of her ongoing concerns.
  • Corrective Action. Get the manager or employee to clean the bathroom in that restaurant.
  • Continuous Improvement. Create new process for restaurants to check and clean bathrooms on a regular basis.
  • Strategic Change. As part of new restaurant formats, design bathrooms so that they don’t require as much time from employees to keep them clean.

The bottom line: Make sure to build out four closed loops.

Report: Tech Vendors: Product and Relationship Satisfaction, 2016

1601_DS_TechProductsAndRelationships_COVERWe just published a Temkin Group data snapshot, Tech Vendors: Product and Relationship Satisfaction of IT Clients, 2016.

During Q3, 2015, 800 IT professionals from companies with at least $250 million in annual revenues rated both the products of and their relationships with 62 tech vendors. The research examines satisfaction with eight areas: product/service features, product/service quality, product/service flexibility, product/service ease of use, technical support, support of the account team, cost of ownership, and innovation of company. Some of the findings include that Intel, Google, and HP outsourcing earned the highest overall satisfaction ratings, while Unisys, Sage, and Cognizant IT services earned the lowest. When it comes to product satisfaction, Intel leads in product features, Apple and IBM IT services lead in product quality, Google leads in product flexibility, and NetApp leads in product ease of use. When it comes to relationship satisfaction, HP outsourcing leads in tech support and in cost of ownership, Intel leads in account team support, and Google leads in innovation.

This product has a report (.pdf) and a dataset (excel). The dataset has the details of Product/Service and Relationship satisfaction for the 62 tech vendors as well as for several tech vendors with sample sizes too small to be included in the published report.

Download report for $495
(includes Excel spreadsheet with data)
BuyDownload3

As you can see in the chart below, the overall product/service & relationship satisfaction ranges from a high of 74% for Intel down to a low of 46% for Unisys.

1601_ProductRelationshipSatisfaction_Ratings

The chart below shows the average scores across all satisfaction criteria. Tech vendors scored the highest in innovation (64%) and the lowest in cost of ownership (56%).1601_ProductRelationshipSatisfaction_Elements

Report details: When you purchase this research, you will receive a written data snapshot and an excel spreadsheet with more data.The dataset has the details of Product/Service and Relationship satisfaction for the 62 tech vendors as well as for several tech vendors with sample sizes too small to be included in the published report. If you want to know more about the data file, download this SAMPLE SPREADSHEET without the data (.xls).

Download report for $495
(includes Excel spreadsheet with data)
BuyDownload3

Report: The State of CX Metrics, 2015

1512_StateOfCXMetrics2015_COVERWe published a Temkin Group report, The State of CX Metrics, 2015. This is the fifth year of this study that examines the CX metrics efforts within large companies. Here’s the executive summary:

Temkin Group surveyed nearly 200 large companies to learn about how they use customer experience (CX) metrics, and we then compared their answers with similar studies we’ve conducted every year since 2011. The most commonly used metrics continue to be likelihood-to-recommend and satisfaction, while the most successful metric is interaction satisfaction. And although the percentage of companies where senior leaders regularly refer to CX metrics has increased significantly from last year, fewer companies are making explicit trade-offs between CX metrics and financial metrics. Companies are best at measuring customer service and phone-based experiences and are worst at measuring the experiences of prospects and customers who defect. In addition to answering survey questions, we also had companies complete Temkin Group’s CX Metrics Competency and Maturity Assessment, which examines four areas of a metrics program: consistent (does the company use common CX metrics across the organization?), impactful (do the CX metrics inform important decisions?), integrated (are trade-offs made between CX and financial metrics?), and continuous (do leaders regularly examine the CX metrics?). Only 14% of respondents received at least a “good” overall rating, and companies earned the lowest rating in integrated. Ultimately, companies with stronger CX metrics programs deliver better customer experience, have stronger business results, more frequently measure ease of doing business, and compensate more employees based on CX metrics.

See the State of CX Metrics studies from 2011, 20122013, and 2014.

Download report for $195
BuyDownload3

Here are the results form our CX Metrics Competency & Maturity Assessment:

1512_CXMetricsAssessmentResults

Here are some other highlights of the research:

  • Forty-nine percent of companies with stronger CX metrics programs have well above average customer experience compared to 17% of those with weaker CX metrics programs. The stronger CX metrics programs are also 50% more likely to have significantly better business performance then their competitors.
  • While 64% of respondents rate their company as good or very good at collecting and sharing CX metrics, only 22% gave themselves those high marks when it came to making trade-offs between CX metrics and financial metrics.
  • Likelihood to recommend and satisfaction remain the most popular CX metrics, while companies are most successful in using satisfaction as a measure of specific customer interactions.
  • Seven out of 10 companies have compensation tied to CX metrics for some of their employees. Net Promoter® Score is the most common metric used and customer service is the most common group to have its compensation tied to CX metrics.
  • Companies are most effective at measuring customer service and phone interactions and least effective at measuring the experiences of prospects and customers who have defected.

Download report for $195
BuyDownload3

P.S. Net Promoter Score, Net Promoter, and NPS are registered trademarks of Bain & Company, Satmetrix Systems, and Fred Reichheld.

Report: 2015 Temkin Loyalty Index

1511_TemkinLoyaltyIndex_COVERWe published a Temkin Group report, 2015 Temkin Loyalty Index. This report ranks the loyalty of consumers to 293 companies across 20 industries. Here’s the executive summary:

The 2015 Temkin Loyalty Index evaluates the loyalty of 10,000 U.S. consumers to 293 companies across 20 industries. The Index is based on evaluating consumers’ likelihood to do five things: repurchase from the company, recommend the company to others, forgive the company if it makes a mistake, trust the company, and try the company’s new offerings. Our research shows that USAA, H-E-B, Publix, and Trader Joe’s are at the top of the list when it comes to consumer loyalty, while Con Edison of NY, Coventry Health Care, Comcast, and Time Warner Cable are at the bottom. At an industry level, supermarkets, fast food chains, and retailers inspire the highest loyalty levels. At the other end of the spectrum, TV service providers and Internet service providers have the lowest levels of loyalty. USAA, JetBlue Airways, TriCare, credit unions, ACE Rent A Car, Apple, and Georgia Power have loyalty levels that most outperform their industry averages. Conversely, Con Edison of NY, RadioShack, Blackboard, Coventry Health Care, Citibank, Jeep, Bi-Lo, and McDonalds fall farthest behind their peers.

Download report for $395
(includes report plus dataset in Excel)
BuyDownload3

Here are the leaders and laggards as well as the industry scores:

1511_TLi_TopBottom

1511_TLi_IndustryRanges

Here are some other highlights of the research:

  • The Temkin Loyalty Index is an average rating across consumers’ likelihood to do five things:
    • Repurchase from the company
    • Recommend the company to others
    • Forgive the company if it makes a mistake
    • Trust the company
    • Try the company’s new offerings
  • At an industry level, supermarkets, fast food chains, and retailers have the highest loyalty levels. At the other end of the spectrum, TV service providers and Internet service providers have the lowest.
  • USAA (for credit cards, banking, and insurance), JetBlue Airways, TriCare, credit unions, ACE Rent A Car, Apple, and Georgia Power have loyalty levels that most outperform their industry averages.
  • Con Edison of NY, RadioShack, Blackboard, Coventry Health Care, Citibank, Jeep, Bi-Lo, and McDonalds fall farthest behind their peers.
  • The average likelihood to purchase across all industries is the highest (67%) while the average likelihood to try new offerings is the lowest (42%).
  • H-E-B and USAA lead, and Con Edison of NY lags in repurchase.
  • Aldi and Hy-Vee lead, and Coventry Health Care lags in recommendations.
  • USAA and ACE Rent A Car lead, and Con Edison of NY lags in forgiveness.
  • ACE Rent A Car leads, and Citibank and Citizens lag in new product loyalty.
  • Credit unions and H-E-B lead, and Comcast lags in trust.

Download report for $395
(includes report plus dataset in Excel)
BuyDownload3

If you want to know what data is included in this report and dataset, download this sample Excel dataset file.

Report: ROI of Customer Experience, 2015

1510_RoIofCX_COVERWe published a Temkin Group report, ROI of Customer Experience, 2015. This research shows that CX is highly correlated to loyalty across 20 industries. Here’s the executive summary:

To understand the connection between customer experience (CX) and loyalty, we examined feedback from 10,000 U.S. consumers that describes both their experiences with and their loyalty to 293 companies across 20 industries. Our analysis shows a strong correlation between customer experience and loyalty factors such as repurchasing, trying new offerings, forgiving mistakes, and recommending the company to friends and colleagues. While all three components of customer experience—success, effort, and emotion—have a strong effect on loyalty, our research shows that emotion is the most important element. When we compared the consumers who gave companies a very good customer experience rating to those who gave companies a very bad customer experience rating, we found that at companies with high customer experience ratings, the percentage of customers who plan on purchasing more is 18 points higher, the percentage who will forgive the company if it makes a mistakes is 12 points higher, the percentage who will try a new offering is 10 points higher, and the percentage who trust the company is 19 points higher. Additionally, companies with very good CX ratings have an average Net Promoter® Score that is 24 points higher than the scores of companies with poor CX. We built a model to evaluate how, over a three-year period, customer experience impacts the revenue of a $1 billion business within each of the 20 industries. This model shows that CX has the largest impact on the revenue of hotels ($823 million) and rental cars ($755 million) over three years. This report also includes a five-step approach for building a model that estimates the value of CX for your organization.

Download report for $295
BuyDownload3

This is the first figure in the report, and it shows the high correlation between Temkin Experience Ratings (customer experience) and purchase intentions for 293 companies across 20 industries:
1510_CXvsRepurchase

Here’s an excerpt from the graphic showing the three year impact on revenues for a $1 billion company in 20 different industries:

1510_ROIRevenues

Download report for $295
BuyDownload3

To see the customer experience levels of all 293 companies, download to the free 2015 Temkin Experience Ratings report.

P.S. Net Promoter Score, Net Promoter, and NPS are registered trademarks of Bain & Company, Satmetrix Systems, and Fred Reichheld.

Report: Net Promoter Score Benchmark Study, 2015

1510_NPSBenchmarkStudy_COVERWe published a Temkin Group report, Net Promoter Score Benchmark Study, 2015. This is the fourth year of this study that includes Net Promoter® Scores (NPS®) on 291 companies across 20 industries based on a study of 10,000 U.S. consumers. Here’s the executive summary:

Many companies use Net Promoter® Score (NPS) to evaluate their customer loyalty, so we measured the NPS of 291 companies across 20 industries. The three companies with the highest scores are USAA, with an NPS of 70, and Lexus and Mercedes-Benz, each with an NPS of 62. Additionally, USAA’s banking, credit card, and insurance businesses all outpaced their respective industries’ averages by more than any other company. Meanwhile, at the bottom of the list, Comcast, Time Warner Cable, and McDonalds received the three lowest scores, and RadioShack, McDonalds, and eMachines fell the farthest below their respective industries’ averages. On an industry level, auto dealers earned the highest average NPS, while Internet service providers and TV service providers earned the lowest. Thirteen of the 20 industries increased their average NPS from last year, with banks enjoying the biggest jump in scores. Out of all the companies, HSBC’s and AirTran Airways’ scores improved the most, whereas Fujitsu’s and Highmark’s scores declined the most. For most industries, older consumers gave companies a higher NPS, while younger consumers gave companies a lower NPS. Investment firms have the largest generation gap.

See the NPS Benchmark Studies from 2012, 2013, and 2014.

Here’s a list of companies included in this study (.pdf).

Download report for $495
(includes report plus dataset in Excel)
BuyDownload3

Here are the NPS scores across 20 industries:
1510_NPS_IndustryRanges

Here are some other highlights of the research:

  • USAA’s insurance business earned the highest NPS (70), followed by Lexus (62) and Mercedes-Benz (62). Other firms to earn an NPS of 55 or more are H-E-B, USAA’s banking and credit card businesses, Apple’s computer business, Chick-fil-A, Wegmans, JetBlue Airways, and Amazon.
  • Comcast TV service (-17) earned the lowest NPS, followed by two firms that also had scores below -10: Time Warner Cable TV service and McDonalds. Other firms to earn NPS of -5 or below are Commonwealth Edison, Pacific Gas and Electric, Charter Communications (TV service and Internet service), Comcast Internet service, RadioShack, Time Warner Cable Internet service, Cablevision Optimum, and Coventry Health Care.
  • USAA’s insurance, banking, and credit card businesses earned NPS levels that are 38 or more points above their industry averages. Eight other firms more than 25 points above their peers: Chick-fil-A, TriCare, credit unions, JetBlue Airways, H-E-B, Wegmans, Amazon, and Apple.
  • Nine companies fell 30 or more points below their industry averages: RadioShack, McDonalds, eMachines, Travelers, Super 8, 7-Eleven, and Spirit Airlines.
  • HSBC’s NPS increased by 29 points between 2014 and 2015, the largest increase of any company. Nine other companies improved by more than 15 points: AirTran Airways, Baskin Robbins, Virgin America, Regions Bank, Citizens Bank, BMW, Southern California Gas, Morgan Stanley Smith Barney, and Food Lion.
  • Fujitsu, Highmark, Buick, and Humana had the largest decline in NPS between 2014 and 2015.

Download report for $495
(includes report plus dataset in Excel)
BuyDownload3

If you want to know what data is included in this report and dataset, download this sample Excel dataset file.Screen Shot 2014-10-17 at 4.05.17 PM

P.S. Net Promoter Score, Net Promoter, and NPS are registered trademarks of Bain & Company, Satmetrix Systems, and Fred Reichheld.

Report: Tech Vendor NPS Benchmark, 2015 (B2B)

1509_IT_NPSBenchmark_COVERWe just published a Temkin Group report, Tech Vendor NPS Benchmark, 2015, The research examines Net Promoter Scores and the link to loyalty for 62 tech vendors based on feedback from IT decision makers in large North American organizations. We also compared overall results to our benchmarks from the previous three years. Here’s the executive summary:

To examine the link between Net Promoter Scores® (NPS®) and loyalty, we surveyed 800 IT decision-makers from large North American firms to learn about their relationships with their technology providers. Of the 62 tech vendors we evaluated, SAS Institute, HP outsourcing, and Intel earned the highest NPS, while Accenture, CA Technologies, and Hitachi received the lowest. Overall, the tech vendor industry’s average NPS jumped to 31.8 in 2015—an increase of more than eight points—after two straight years of declining scores. Our analysis shows that promoters are much more likely than detractors to spend more money with tech vendors, try new products and services when they are announced, and forgive their tech vendors after a bad experience. Our results also revealed that SAS Institute and Cognizant outsourcing were the top companies for purchase momentum, IBM SPSS and Intel have the highest Temkin Innovation Equity Quotient, and HP outsourcing and Intel scored the highest in the Temkin Forgiveness Ratings.

The report includes graphics with data for NPS, purchase intentions, likelihood to forgive, and likelihood to try a new offering. The excel spreadsheet includes this data (in more detail) for the 62 companies as well as for 25 other tech vendors with less than 40 pieces of feedback. It also includes the summary NPS scores from 2014.

Download report for $695
(includes Excel spreadsheet with data)
BuyDownload3

As you can see in the chart below, the NPS ranges from a high of 57 for SAS Institute down to  a low of 1 for Accenture consulting.

1509_TechNPS_Listing

After declining for the past two years, the industry average NPS increased to 31.8 this year, almost reaching the level from our initial study in 2012. The research also includes data for Purchase Momentum (how much customers are planning to buy), Temkin Forgiveness Ratings (likelihood of customers to forgive after a bad experience), and Temkin Innovation Equity Quotient (likelihood of customer to try a new offering). We not only list the results for each company, but we also show that NPS is highly correlated to each of these items (as you can see below for Purchase Momentum).

1509_TechNPS_TrendPurchase

Report details: When you purchase this research, you will receive a written report and an excel spreadsheet with more data. The report includes graphics with data for NPS, purchase momentum, Temkin Forgiveness Ratings, and Temkin Innovation Equity Quotient for the 62 tech vendors that had at least 40 pieces of feedback. The excel spreadsheet includes this data (in more detail) for the 62 companies as well as for 25 other tech vendors with less than 40 pieces of feedback. It also includes the summary NPS scores from 2014. If you want to know more about the data file, download this SAMPLE SPREADSHEET without the data (.xls).

Download report for $695
(includes Excel spreadsheet with data)
BuyDownload3

Note: See our 2014 NPS benchmark2013 NPS benchmark and 2012 NPS benchmark for tech vendors as well as our page full of NPS resources.

P.S. Net Promoter Score, Net Promoter, and NPS are registered trademarks of Bain & Company, Satmetrix Systems, and Fred Reichheld.

Is Net Promoter Score A Savior Or A Demon?

Every couple of years, I get a resurgence of questions about Net Promoter® Score (NPS®). These surges typically coincide with research that shows how NPS is either an excellent predictor or a terrible predictor of company performance. That data often ignites a religious battle between the NPS lovers and NPS haters.

Well, it’s one of those times.

Let me start by saying that I’m an atheist in this NPS battle. We’ve had the opportunity to study and work with hundreds of companies that use NPS. I’ve recommended to some companies that they adopt NPS, to others that they stop using NPS, and to others that they start with a totally different set of metrics (see our VoC/NPS resource page).

Let’s look at what we know for sure about NPS…

The reality is that the metric itself is much less important than how it is used. I’d rather use a sub-optimal metric in a way that drives positive improvements across an organization, than have a perfect metric that doesn’t result in as much impact.

Here are some quick answers to key questions:

  • Is NPS the best indicator of customer loyalty and business performance? In many cases, no.
  • Can other metrics be used to drive positive change? Yes.
  • Does NPS provide an easy to understand metric that can be widely adopted? Yes.
  • Can NPS be used to make an organization more customer centric? In many cases, yes.
  • Will a company improve if it increases promoters and decreases detractors? In many cases, yes.
  • Can NPS be used inappropriately? Yes.
  • Can any metric be used inappropriately? Yes.
  • Would I ever recommend NPS for every touch point? No.
  • Should companies consider their specific business when selecting metrics? Absolutely.
  • What’s more important, the metric or the improvement process? The improvement process.

The bottom line: NPS is neither a savior nor a demon.

P.S. In case you didn’t know, NPS® and Net Promoter® are registered trademarks of Fred Reichheld, Satmetrix, and Bain & Company.

Report: Net Promoter Score Benchmark Study, 2014

1410_NPSBenchmarkStudy_COVERWe published a Temkin Group report, Net Promoter Score Benchmark Study, 2014. This is the third year of this study that includes Net Promoter® Scores (NPS®) on 283 companies across 20 industries based on a study of 10,000 U.S. consumers. Here’s the executive summary:

We measured the Net Promoter Score of 283 companies across 20 industries. USAA and JetBlue took the top two spots, each with an NPS of more than 60. USAA’s banking, credit card, and insurance businesses outpaced their industries’ averages by more than any other company. At the bottom of the list, HSBC and Citibank received the two lowest scores, and Super 8 and Motel 6 fell the farthest below their industry averages. On an industry level, auto dealers earned the highest average NPS, while TV service providers earned the lowest. Eleven of the 19 industries increased their average NPS from last year, with car rentals and credit cards enjoying the biggest score boosts. Out of all the companies, US Airways and Highmark BCBS improved the most, while Quality Inn and Baskin-Robbins declined the most. For most industries, the average NPS is highest with older consumers and is lowest with younger consumers. Investment firms have the largest generation gap.

Here’s a list of companies included in this study (.pdf).

Download report for $495
(includes report plus dataset in Excel)
BuyDownload3

Here are the NPS scores across 20 industries:

1410_industryNPS

Download report for $495
(includes report plus dataset in Excel)
BuyDownload3

If you want to know what data is included in this report and dataset, download this sample Excel dataset file.Screen Shot 2014-10-17 at 4.05.17 PM

P.S. Net Promoter Score, Net Promoter, and NPS are registered trademarks of Bain & Company, Satmetrix Systems, and Fred Reichheld.