
We recently released the 2016 Temkin Experience Ratings that ranks the customer experience of 294 companies across 20 industries based on a survey of 10,000 U.S. consumers.
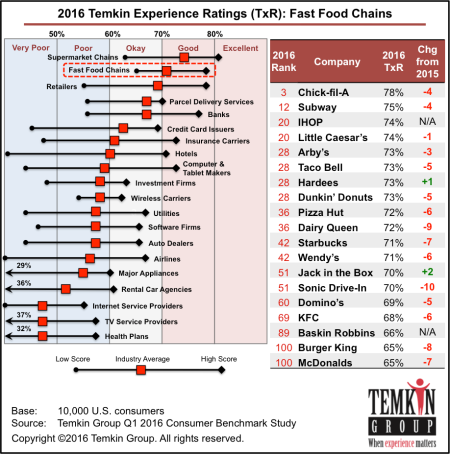
Chick-fil-A and Subway deliver the best customer experience in the fast food industry, according to the 2016 Temkin Experience Ratings, an annual ranking of companies based on a survey of 10,000 U.S. consumers.
Chick-fil-A took the top spot for the fifth year in a row with a rating of 78%, putting it in 3rd place out of 294 companies across 20 industries. Subway, meanwhile, came in second with a rating of 75% and an overall ranking of 12th.
At the other end of the spectrum, McDonalds and Burger King tied as the lowest scoring fast food restaurants. Each received a rating of 65%, putting them in 100th place. Only three other fast food chains failed to earn at least a “good” rating: Baskin Robbins, KFC, and Domino’s.
Overall, the fast food industry averaged a 71% rating in the 2016 Temkin Experience Ratings and placed 2nd out of 20 industries. The average rating of the industry decreased by five percentage-points between 2015 and 2016, dropping from 76% to 71%.
Here are some additional findings from the fast food industry: Read more of this post
Filed under 2016 Temkin Ratings, Customer experience
Tagged with Arby's, Baskin Robbins, Burger King, Chick-fil-A, Dairy Queen, Domino's, Dunkin' Donuts, Hardees, IHOP, Jack in the Box, KFC, Little Caesar's, McDonalds, Pizza Hut, Sonic Drive-In, Starbucks, Subway, Taco Bell, Wendy's
We recently released the 2015 Temkin Experience Ratings that ranks the customer experience of 293 companies across 20 industries based on a survey of 10,000 U.S. consumers.
Chick-fil-A took the top spot for the fourth year in a row, earning a rating of 82%, which put it in 4th place out of 293 companies across 20 industries. Papa John’s—a newcomer to the Ratings—came in second with a rating of 81% and an overall ranking of 8th. Four other fast food chains earned an “excellent” rating: Dairy Queen, Panera Bread, Subway, and Sonic Drive-In. The only fast food company not to receive at least a “good” score was Jack in the Box, who received a rating of 67% and placed 128th overall.
Overall, the fast food industry averaged a 76% rating in the 2015 Temkin Experience Ratings and came in 2nd place out of 20 industries. It was also one of the 14 industries whose ratings declined in the past year, with its average decreasing by 2.0 percentage-points.
Here are some additional findings:
- The ratings of all fast food chains in the Ratings are as follows: Chick-fil-A (82%), Papa John’s (81%), Dairy Queen (80%), Panera Bread (80%), Subway (80%), Sonic Drive-In (80%), Dunkin’ Donuts (78%), Pizza Hut (78%), Popeye’s (78%), Taco Bell (78%), Starbucks (77%), Chipotle Mexican Grill (77%), Wendy’s (77%), Arby’s (76%), Little Caesar’s (75%), Domino’s (74%), Panda Express (74%), KFC (74%), Burger King (73%), Hardees (72%), McDonalds (72%), and Jack in the Box (67%).
- Dunkin’ Donuts (+2 points) and Taco Bell (+1 point) were the only fast food companies to improve their ratings between 2014 and 2015.
- Jack in the Box (-9 points), Burger King (-7 points), Little Caesar’s (-5 points), and Domino’s (-5 points) declined by the most percentage-points between 2014 and 2015.
Read more of this post
Filed under 2015 Temkin Ratings, Customer experience
Tagged with Arby's, Burger King, Chick-fil-A, Chipotle Mexican Grill, Dairy Queen, Domino's, Dunkin' Donuts, Hardees, Jack in the Box, KFC, Little Caesar's, McDonalds, Panda Express, Panera Bread, Papa John's, Pizza Hut, Popeye's Louisiana Kitchen, Sonic Drive-In, Starbucks, Subway, Taco Bell, Wendy's
In a previous post, I defined the three elements of an experience: Success, Effort, and Emotion.
Emotion is a significant blind spot for most organizations. In the Temkin Group report State of CX Metrics, 2013, we found that only 11% of large companies feel that they do a very good job of measuring customers’ emotional responses. Our ROI of Customer Experience, 2014 shows that emotion is the most significant driver of loyalty, especially when it comes to consumers recommending firms to their friends.
We’ve been measuring emotion as part of our Temkin Experience Ratings for four years. Our emotion rating is based on asking consumers the following question:
Thinking of your most recent interactions with each of these companies, how did you feel about those interactions?
Responses range from 1 (upset) to 7 (delighted) and the emotion rating is calculated as the percentage of consumers who select 6 or 7 minus the percentage who select 1, 2, or 3.
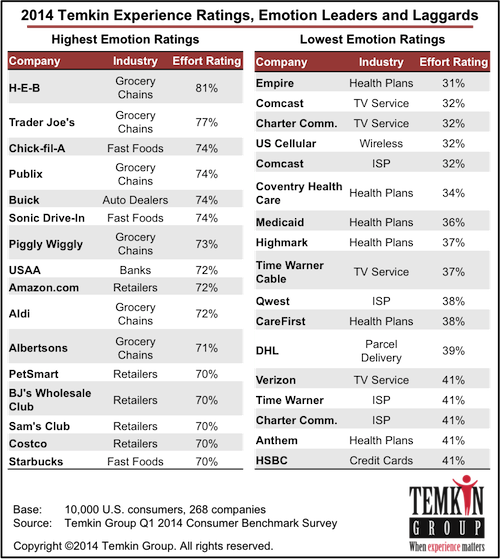
As you can see in the list of leaders and laggards below (from ratings of 268 companies across 19 industries based on a survey of 10,000 U.S. consumers), H-E-B earned the highest overall emotion rating of 84%, outpacing second place Trader Joe’s by three points.
At the other end of the spectrum, Empire BCBS earned the l0west rating of 31% and several companies were just slightly better with 32%: Comcast (Internet and TV service), Charter Communications, and US Cellular.

The bottom line: Stop ignoring how your customers feel.
Filed under Customer experience, Emotion
Tagged with BCBS, Burger King, Chick-fil-A, Chrysler, Comcast, Coventry Health Care, credit unions, Dairy Queen, Empire, Food Lion, H.E.B, Haier, Highmark, Hitachi, Kroger, Little Caesar's, Medicaid, Motel 6, Piggly Wiggly, Publix, Regions, Residence Inn, Sonic Drive-In, Starbucks, Super 8, Trader Joe's, US Airways
 We published a Temkin Group report, Evaluating Mobile eGift Card Purchasing Experiences. The report uses Temkin Group’s SLICE-B experience review methodology to assess the mobile sites of 10 retailers. Here’s the executive summary:
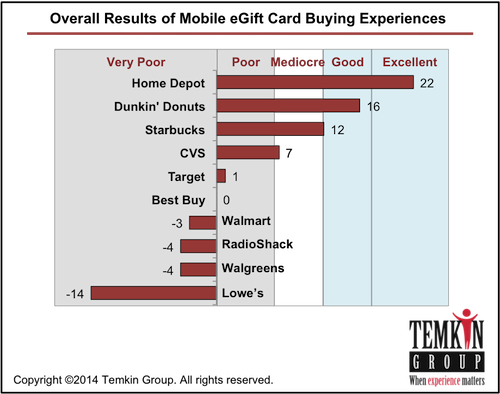
Although smartphones are a convenient interaction channel, their small screens pose serious design challenges for companies. To evaluate the customer experience of mobile websites, we used Temkin Group’s SLICE-B experience review methodology to assess the experience of buying an eGift Card from ten large retailers: Home Depot, Lowe’s, Walmart, Target, Walgreens, CVS, Starbucks, Dunkin’ Donuts, Best Buy, and RadioShack. Home Depot earned the top score for its functionality and minimalist processes, while the user could not complete the full purchasing goal at Lowe’s, Walmart, Target, Walgreens, CVS, Best Buy, or RadioShack.
Download report for $195

The report includes the scores for all 10 companies across each of the six SLICE-B categories, strengths and weaknesses of each retailer, and some best practices across all of the mobile sites. Here is a description of the user and her overall goal that we tested:
Our user was a middle-aged woman looking to send her niece a $25 electronic gift card to help her get settled into her new apartment. While she is reasonably proficient at operating a smartphone, she finds entering a lot of information to be difficult on the small keyboard. She has an iPhone 4s. She does not have an app for any of the companies being evaluated and does not know whether they sell $25 eGift Cards.
Here are the overall results:
Download report for $195
The bottom line: Gift cards should be easier to buy via mobile phones.
Filed under Assessments, Bruce Temkin Research, Customer Connectedness, Customer experience, CX measurement, Isabelle Zdatny Research, Temkin Group Research
Tagged with Best Buy, CVS, Dunkin' Donuts, Home Depot, Lowe's, RadioShack, Starbucks, Target, Walgreens, WalMart
 We just published a Temkin Group report, What Happens After a Good or Bad Experience, 2014. The report, which includes 19 data charts, examines which companies and industries provide the most bad experiences, what impact those experiences have on spending, and how the negative impacts of bad experiences can be mitigated by good service recovery. The report also examines how consumers share their good and bad experiences with companies as well as with other people. Here’s the executive summary:
To understand the effect of good and bad experiences, we asked 10,000 U.S. consumers about their recent interactions with 268 companies across 19 industries. Results show that Internet services and TV services are the industries most likely to deliver a bad experience to their customers, while grocery chains are the least likely to. At the company level, Scottrade had the smallest percentage of customers reporting a recent bad experience with the company and Time Warner Cable had the highest. More than half of the customers who encountered a bad experience at a fast food chain, credit card issuer, grocery store, or hotel either decreased their spending with the company or stopped altogether. However, our data shows that a good service recovery effort can help mitigate a bad experience. Unfortunately, many firms—especially in the banking, Internet services, and TV services sectors—aren’t very good at service recovery. In addition to the consequences of bad interactions, we also examined which channels customers use to share their good and bad experiences and how these changed across age groups. We then compared these results to survey responses from the past two years. We also uncovered a negative bias inherent in how customers provide feedback. ING Direct, Residence Inn, and Fairfield Inn have the most negative bias in the feedback they receive directly from customers, while Hy-Vee and Hyundai have the most negative bias on Facebook.
Click link to see full list of industries and companies covered in this report (.pdf).
Download report for $195
One of the most interesting analyses in the report is the look at how service recovery after a bad experience affects the spending pattern of consumers. Here’s a summary of one of the charts showing just how important it is for a company to recover well after making a mistake:

Here are some other insights from the research:
- Sixteen percent of consumers who have interacted with TV service and Internet service providers report having a bad experience over the previous six months. Next on the list are wireless carriers, with 12% of their customers reporting a bad experience. At the other end of the spectrum, only 3% of consumers report a bad experience with grocery chains and 4% report having a bad experience with fast food chains.
- The five companies with the most customers reporting bad experiences are Time Warner Cable (25%), Motel 6 (22%), Coventry Health Care (21%), and Comcast (21%). There were 10 companies with only 1% or less of their customers reporting bad experiences: Scottrade, Chick-fil-A, H.E.B., Whole Foods, ShopRite, ING Direct, Starbucks, Trader Joe’s, Vanguard, and True Value.
- More than one-quarter of consumers who have a bad experience stop spending with computer makers, car rental agencies, credit card issuers, hotel chains, and software companies. The impact of bad experiences is less costly for parcel delivery services, wireless carriers, health plans, TV service providers, Internet service providers, and grocery chains, as less than 15% of their customers with bad experience stopped spending.
- The industries that are the best at responding to a bad experience are investment firms, major appliances, retailers, and car rental agencies. The industries that are the worst at responding to a bad experience are TV service providers, wireless carriers, Internet service providers, parcel delivery services, and health plans.
- Thirty-two percent of consumers give feedback directly to companies after a very bad experience and 23% give feedback after a very good experience.
- Overall, 25- to 34-year-olds are the most likely to share feedback about their experiences. After a good experience 57% tell a friend directly, 28% share on Facebook, and 18% put a comment or rating on a review site. After a bad experience, 60% tell a friend directly, 31% share on Facebook, and 20% write a review.
Download report for $195
The bottom line: Make sure to recover quickly after a bad experience
Filed under Benchmarks, Bruce Temkin Research, Customer Connectedness, Customer experience, Temkin Group Research, Trends
Tagged with 21st Century, 7-Eleven, A&P, AAA, Ace Hardware, Acer, Activision, Adobe, Advance Auto Parts, Aetna, AIG, AirTran Airways, ALamo, Alaska Airlines, Albertsons, Aldi, Allstate, Amazon.com, American Airlines, American Express, American Family, Ameriprise Financial, Anthem, AOL, Apple, Arby's, AT&T, Audi, AutoZone, Avis, Bank Of America, Barclaycard, Barnes & Noble, Baskin Robbins, Bed Bath & Beyond, Best Buy, Best Western, BJs Wholesale Club, Blackboard, Blue Shield of California, BMW, Bosch, Bright House, Budget, Buick, Burger King, Cablevision, Cadillac, Capital One, CareFirst, Charles Schwab, Charter Communications, Chase, Chevrolet, Chick-fil-A, Chrysler, Cigna, Citibank, Citigroup, Citizens, Comcast, Comfort Inn, Compaq, Costco, Courtyard By Marriott, Coventry Health Care, Cox Communications, credit unions, Crowne Plaza, CVS, Dairy Queen, Days Inn, Dell, Delta, DHL, DirecTV, Discover, Dish Network, Dodge, Dollar, Dollar General, Dollar Tree, Domino's, Dunkin' Donuts, E*Trade, eBay, Edward Jones, Electrolux, eMachines, Empire, Enterprise, Fairfield Inn, Family Dollar, Farmers, FedEx, Fidelity Investments, Fifth Third, Food Lion, Foot Locker, Ford, Fujitsu, GameStop, Gap, Gateway, GE, Geico, Giant Eagle, GM, Google, H.E.B, Haier, Hampton Inn, Hardees, Health Net, Hertz, Hewlett-Packard, Highmark, Hilton, Hitachi, Holiday Inn, Holiday Inn Express, Home Depot, Honda, HSBC, Humana, Hy-Vee, Hyatt, Hyundai, ING Direct, Intuit, Jack in the Box, JCPenney, Jeep, JetBlue Airlines, Kaiser Permanente, KFC, Kia, Kmart, Kohl's, Kroger, La Quinta Inn, Lenovo, Lexus, LG, Liberty Mutual, Little Caesar's, Lowe's, Macy's, Marriott, Marshalls, Mazda, McAfee, McDonalds, Medicaid, Medicare, Mercedes Benz, Merrill Lynch, MetLife, MetroPCS, Microsoft, Morgan Stanley Smith Barney, Motel 6, MSN, National, Nationwide, New York Life, Nissan, Nordstrom, O'Reilly Auto Parts, Office Depot, OfficeMax, Old Navy, Optimum (iO)/Cablevision, Orange Julius, PetSmart, Piggly Wiggly, Pizza Hut, PNC, Progressive, Publix, Quality Inn, Quiznos, QVC, Qwest, RadioShack, Regions, Residence Inn, Rite Aid, Ross, Safeway, Sam's Club, Samsung, Save-a-Lot, Scottrade, Sears, Sheraton, ShopRIte, Sonic Drive-In, Sony, Southwest Airlines, Sprint, Staples, Starbucks, State Farm, Stop & Shop, Subway, SunTrust Bank, Super 8, Symantec, T-Mobile, T.J. Maxx, Taco Bell, Target, TD Ameritrade, TD Bank, The Hartford, Time Warner Cable, Toshiba, Toyota, Toys "R" Us, TracFone, Trader Joe's, Travelers, TriCare, True Value, U.S. Bank, United Airlines, United Healthcare, UPS, US Airways, US Cellular, US Postal Service, USAA, Vanguard, Verizon, Verizon Wireless, Virgin Mobile, Volkswagen, Wal-Mart, Walgreens, Wells Fargo, Wendy's, Westin, Whirlpool, Whole Foods, Winn-Dixie
 I recently completed a series of 50 customer experience (CX) tips. To make it easier for people to read and download all of the tips, I assembled them into a free eBook: 50 CX Tips: Simple Ideas, Powerful Results.
Each of the 50 CX Tips is aligned with one or more of Temkin Group’s four customer experience core competencies: Purposeful Leadership, Compelling Brand Values, Employee Engagement, and Customer Connectedness.
The CX Tips include examples from a wide variety of companies including Adobe, Amazon.com, Apple, BCBS of Michigan, Becker and Poliakoff, Big Lots, BMO Financial Group, Bombardier Aerospace, CDW, Charles Schwab, Citrix, Disney, EMC, Fidelity Investments, Hampton Inn, Hilton, IBM, Intersil, Intuit, JetBlue, Microsoft, Oklahoma City Thunder, Oracle, Safelite AutoGlass, Salesforce.com, SanDIsk, SimplexGrinnell, Southwest Airlines, Sovereign Assurance of NZ, Sprint, Starbucks, Stream Global Services, Sam’s Club, USAA, VMware, and ZocDoc.

While you may have a hard time applying all 50 CX TIps, you should be able to identify several that will work for your organization. I challenge you to select three or more of the CX Tips to implement. Here’s an idea: Have each of your team members pick the five CX Tips that they think would be the most powerful for your organization. Use a team meeting to discuss everyone’s selections and pick the ones you want to implement.
We also created an infographic with the 50 CX tips. Here’s a version with the top 10 CX tips (click on the graphic to get a .pdf of the full infographic).
") The bottom line: A handful of CX Tips can propel your customer experience.
The bottom line: A handful of CX Tips can propel your customer experience.
Filed under Customer experience, eBook, Infographic
Tagged with Adobe, Amazon.com, Apple, BCBS of Michigan, Becker and Poliakoff, Big Lots, BMO Financial Group, Bombardier Aerospace, CDW, Charles Schwab, Citrix, Disney, EMC, Fidelity Investments, Hampton Inn, Hilton, IBM, Intersil, Intuit, JetBlue, Microsoft, Oklahoma City Thunder, Oracle, Safelite AutoGlass, Salesforce.com, SanDIsk, SimplexGrinnell, Southwest Airlines, Sovereign Assurance of NZ, Sprint, Starbucks, Stream Global Services, The Limited Sam’s Club, USAA, VMware, ZocDoc
We just released the third annual Temkin Customer Service Ratings of 235 companies across 19 industries based on a study of 10,000 U.S. consumers (see full list of firms).
Download entire dataset for $295
Company Results
Here are some company highlights:


- USAA earned the top two spots for its insurance and banking businesses. Other companies at the top of the ratings are credit unions, Ace Hardware, Charles Schwab, Dollar Tree, Chick-fil-A, Sonic Drive-In, Hy-Vee, Costco, Trader Joe’s, Advantage, Publix, and H.E.B.
- TV service providers and Internet service providers earned nine out of bottom 10 spots in the ratings.
- For the second straight year, Charter Communications took the bottom spot. The rest of the firms in the bottom five are Time Warner Cable, Cox Communications, Optimum (i/o), and CareFirst.
- The following companies earned ratings that were 15 or more points above their industry averages: USAA (insurance and banking), Alaska Airlines, credit unions, Advantage, Kaiser Permanente, TriCare, Charles Schwab, and Bright House Networks.
- Five companies earned ratings that were 15 or more points below their industry averages: Apple Stores, US Airways, RadioShack, HSBC, and 21st Century.
- Twenty-three percent of companies earned “strong” or “very strong” ratings, while 37% earned “weak” or “very weak” ratings.
Temkin Group also examined year-over-year results for the 171 companies that were in both the 2012 and 2013 Temkin Customer Service Ratings and found that:
- Forty-four percent of companies improved their ratings while 47% experienced a decline.
- Twenty companies showed double-digit increases, led by: Citibank (banking and credit cards), U.S. Bank, Hyundai, Nissan, Old Navy, Charles Schwab, Continental Airlines, and Piggly-Wiggly.
- Eleven companies showed double-digit decreases, led by: LG, Giant Eagle, Toshiba, Cox Communications, ING Direct, and Budget.
Industry Results
Here are some industry highlights:
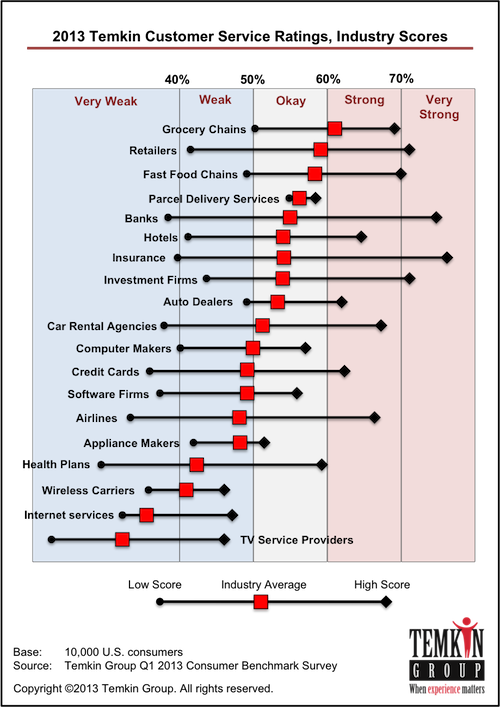
- Grocery chains, retailers, and fast food chains earned the highest average Temkin Customer Service Ratings, while TV service providers, Internet service providers, wireless carriers, and health plans earned the lowest ratings.
- On average, credit card issuers, banks and fast food restaurants improved the most while appliance makers, TV service providers and investment firms declined the most.
Calculating the Temkin Customer Service Ratings
During January 2013, Temkin Group asked 10,000 U.S. consumers to identify the companies that they had interacted with on their websites during the previous 60 days. These consumers were asked the following question:
Thinking back to your most recent customer service interaction with these companies,
how satisfied were you with the experience?
Responses from 1= “very dissatisfied” to 7= “very satisfied”
For all companies with 100 or more consumer responses, we calculated the “net satisfaction” score. The Temkin Customer Service Ratings are calculated by taking the percentage of consumers that selected either “6” or “7” and subtracting the percentage of consumers that selected either “1,” “2,” or “3.”
Download entire dataset for $295

To see all of the companies in the Temkin Customer Service Ratings as ell as all of our other Temkin Ratings and sort through the results, visit the Temkin Ratings website
The bottom line: TV service providers deliver terrible customer service
Filed under 2013 Temkin Ratings, Customer experience, customer service
Tagged with 21st Century, 7-Eleven, A credit union, AAA, Ace Hardware, Acer, Activision, Adobe, Advance Auto Parts, Advantage, Aetna, AirTran Airways, ALamo, Alaska Airlines, Albertsons, Aldi, Allstate, Amazon.com, American Airlines, American Express, American Family, Ameriprise Financial, Anthem (BCBS), AOL, Apple, Apple Store, Arby's, AT&T, AutoZone, Avis, Bank Of America, Barnes & Noble, Bed Bath & Beyond, Best Buy, Best Western, BJs Wholesale Club, Blackboard, Blue Shield of California, BMW, Bosch, bright House Networks, Budget, Burger King, Cablevision, Capital One, CareFirst (BCBS), Charles Schwab, Charter Communications, Chase, Chevrolet, Chick-fil-A, Chrysler, Cigna, Citibank, Citigroup, Citizens, Comcast, Comfort Inn, Compaq, Continental Airlines, Costco, Courtyard By Marriott, Coventry Health Care, Cox Communications, Crowne Plaza, CVS, Dairy Queen, Days Inn, Dell, Delta / Northwest Airlines, DirecTV, Discover, Dish Network / EchoStar, Dodge, Dollar, Dollar General, Domino's, Dunkin' Donuts, E*Trade, Earthlink, Edward Jones, Electrolux, eMachines, Empire BCBS, Enterprise, Fairfield Inn, Farmers, FedEx, Fidelity Investments, Fifth Third, Food Lion, Ford, Gateway, GE, Geico, Giant Eagle, Google, H.E.B, Hampton Inn, Hardees, Health Net, Hertz, Hewlett-Packard, Highmark BCBS, Hilton, Holiday Inn, Holiday Inn Express, Honda, HSBC, Humana, Hy-Vee, Hyatt, Hyundai, ING Direct, Intuit, Jack in the Box, JetBlue Airlines, Kaiser Permanente, KFC, Kia, Kroger, La Quinta, Lenovo, LG, Liberty Mutual, Little Caesar's, Marriott, McAfee, McDonalds, Med, Medicaid, Merrill Lynch, MetLife, MetroPCS, Microsoft, Morgan Stanley Smith Barney, Motel 6, MSN (Microsoft Network), Nationwide, Nissan, Optimum (iO) / Cablevision, Piggly Wiggly, Pizza Hut, PNC, Progressive, Publix, Quiznos, Qwest, Regions, Road Runner, S, Safeway, Samsung, Save-a-Lot, Scottrade, ShopRIte, Sonic Drive-In, Sony, Southwest Airlines, Sprint, Starbucks, State Farm, Stop & Shop, SunTrust Bank, Symantec, T-Mobile, TD Ameritrade, TD Bank, The Hartford, Time Warner Cable, Toshiba, Toyota, TracFone, Trader Joe's, Travelers, U.S. Bank, U.S. Cellular, U.S. Postal Service, United Airlines, UPS, US Airways, USAA, Verizon, Verizon Wireless, Virgin Mobile, Wells Fargo, Whirlpool, Whole Foods, Winn-Dixie
We just released the third annual Temkin Web Experience Ratings of 211 companies across 19 industries based on a study of 10,000 U.S. consumers (see full list of firms).
Download entire dataset for $295
Company Results
Here are some company highlights:

- For the third straight year, Amazon.com topped the Temkin Web Experience Ratings while USAA took the next two spots for its bank and insurance businesses.
- Other companies at the top of the ratings are Regions, U.S. Bank, eBay, Advantage Rent A Car, credit unions, and QVC.
- At the other end of the spectrum, MSN, Health Net, EarthLink, and Cablevision earned the lowest ratings.
- Only 6% of companies earned “strong” or “very strong” ratings, while 63% earned “weak” or “very weak” ratings.
- Amazon.com and USAA’s insurance business earned ratings that were 20 points above their industry averages and eight other companies were at least 10 points above their peers: Kaiser Permanente, Advantage Rent A Car, eBay, QVC, USAA (bank), Sonic Drive-In, Charles Schwab, and Fidelity Investments.
- Health Net and RadioShack earned ratings that were 20 points or more less than their industry averages and six other companies were at least 15 points below their peers: 21st Century, American Family, Days Inn, Taco Bell, and Kmart.
Temkin Group examined year-over-year results for the 154 companies that were in the 2012 and 2013 ratings and found that:
- Forty-one percent of companies improved, while 53% declined.
- Over half of the companies that were in the 2012 and 2013 ratings earned lower scores this year.
- Eight companies showed double-digit increases: Humana, Old Navy, U.S. Bank, Citibank, TriCare, Blue Shield of California, Toyota, and Safeway.
- Twenty-one companies declined by at least 10 points and six companies dropped by more than 15 points: Southwest Airlines, MSN, United Airlines, ShopRite, Cablevision, and Bright House Networks.
Industry Results
Here are some industry highlights:

- Banks earned the highest average Temkin Web Experience Ratings, followed by investment firms, retailers, credit card issuers, and hotel chains.
- Five industries earned average ratings of “very weak” ratings: Internet service providers, TV service providers, airlines, health plans, and wireless carriers.
- Seven industries improved between 2012 and 2013., while nine declined. Airlines suffered the most dramatic drop, losing 15 points.
Calculating the Temkin Web Experience Ratings
During January 2013, Temkin Group asked 10,000 U.S. consumers to identify the companies that they had interacted with on their websites during the previous 60 days. These consumers were asked the following question:
Thinking back to your most recent interaction with the websites of these companies,
how satisfied were you with the experience?
Responses from 1= “very dissatisfied” to 7= “very satisfied”
For all companies with 100 or more consumer responses, we calculated the “net satisfaction” score. The Temkin Web Experience Ratings are calculated by taking the percentage of consumers that selected either “6” or “7” and subtracting the percentage of consumers that selected either “1,” “2,” or “3.”
Download entire dataset for $295
To see all of the companies in the Temkin Trust Ratings as ell as all of our other Temkin Ratings and sort through the results, visit the Temkin Ratings website
The bottom line: Web experiences are heading in the wrong direction.
Filed under 2013 Temkin Ratings, Customer experience
Tagged with 21st Century, 7-Eleven, A credit union, AAA, Ace Hardware, Acer, Activision, Adobe, Advance Auto Parts, Advantage, Aetna, AirTran Airways, ALamo, Alaska Airlines, Albertsons, Aldi, Allstate, Amazon.com, American Airlines, American Express, American Family, Ameriprise Financial, Anthem (BCBS), AOL, Apple, Apple Store, Arby's, AT&T, AutoZone, Avis, Bank Of America, Barnes & Noble, Bed Bath & Beyond, Best Buy, Best Western, BJs Wholesale Club, Blackboard, Blue Shield of California, BMW, Bosch, bright House Networks, Budget, Burger King, Cablevision, Capital One, CareFirst (BCBS), Charles Schwab, Charter Communications, Chase, Chevrolet, Chick-fil-A, Chrysler, Cigna, Citibank, Citigroup, Citizens, Comcast, Comfort Inn, Compaq, Continental Airlines, Costco, Courtyard By Marriott, Coventry Health Care, Cox Communications, Crowne Plaza, CVS, Dairy Queen, Days Inn, Dell, Delta / Northwest Airlines, DirecTV, Discover, Dish Network / EchoStar, Dodge, Dollar, Dollar General, Domino's, Dunkin' Donuts, E*Trade, Earthlink, Edward Jones, Electrolux, eMachines, Empire BCBS, Enterprise, Fairfield Inn, Farmers, FedEx, Fidelity Investments, Fifth Third, Food Lion, Ford, Gateway, GE, Geico, Giant Eagle, Google, H.E.B, Hampton Inn, Hardees, Health Net, Hertz, Hewlett-Packard, Highmark BCBS, Hilton, Holiday Inn, Holiday Inn Express, Honda, HSBC, Humana, Hy-Vee, Hyatt, Hyundai, ING Direct, Intuit, Jack in the Box, JetBlue Airlines, Kaiser Permanente, KFC, Kia, Kroger, La Quinta, Lenovo, LG, Liberty Mutual, Little Caesar's, Marriott, McAfee, McDonalds, Med, Medicaid, Merrill Lynch, MetLife, MetroPCS, Microsoft, Morgan Stanley Smith Barney, Motel 6, MSN (Microsoft Network), Nationwide, Nissan, Optimum (iO) / Cablevision, Piggly Wiggly, Pizza Hut, PNC, Progressive, Publix, Quiznos, Qwest, Regions, Road Runner, S, Safeway, Samsung, Save-a-Lot, Scottrade, ShopRIte, Sonic Drive-In, Sony, Southwest Airlines, Sprint, Starbucks, State Farm, Stop & Shop, SunTrust Bank, Symantec, T-Mobile, TD Ameritrade, TD Bank, The Hartford, Time Warner Cable, Toshiba, Toyota, TracFone, Trader Joe's, Travelers, U.S. Bank, U.S. Cellular, U.S. Postal Service, United Airlines, UPS, US Airways, USAA, Verizon, Verizon Wireless, Virgin Mobile, Wells Fargo, Whirlpool, Whole Foods, Winn-Dixie
We just released the third annual Temkin Trust Ratings of 246 companies across 19 industries (see full list).
Download entire dataset for $295
Company Results
For the third straight year, USAA‘s insurance business earned the top ranking in the Temkin Trust Ratings. Here are additional highlights:

- Two of USAA’s business areas —insurance and banking—topped the list of companies. USAA’s credit card business also ranked sixth.
- The other companies in the top 10 of the ratings are credit unions, Publix, H.E.B., Amazon.com, Trader Joe’s, Charles Schwab, and Sam’s Club.
- HSBC earned two of the bottom three spots for its credit card and banking businesses.
- TV service providers and Internet service providers dominate the bottom of the ratings, collectively taking 10 of the bottom 15 spots. The other companies in the bottom 15 are US Airways, CareFirst, and T-Mobile.
We also examined year-over-year results for 204 companies that were also in the 2012 Temkin Trust Ratings. Here are some highlights of that analysis:
- Citigroup in credit cards and Hyundai earned the largest jump (21 points) over their 2012 Temkin Trust Ratings. The other largest gainers are Alaska Airlines, Bank of America in credit cards and banking, Continental Airlines, Avis, and EarthLink.
- Cox Communications in TV service and Fifth Third in banking lost the most ground (17 points) since last year. The other largest decliners are HSBC in banking, PNC in banking, JCPenney, Bright House Networks, and eMachines in computers.
Industry Results
Here are the highlights of the 19 industries in the 2013 Temkin Trust Ratings:

- Grocery chains earn the most trust while TV service providers earn the least trust from their customers.
- Six companies earned Temkin Trust Ratings that are 20 percentage points or more above their industry average: USAA (banking, credit cards, insurance carriers), credit unions (banking), TriCare (health plans), and Kaiser Permanente (health plans).
- Four companies earned Temkin Trust Ratings that are 20 percentage points or more below their industry average: HSBC (banking and credit cards), US Airways (airlines), 21st Century (insurance carriers).
- Led by credit card issuers and rental car agencies, 14 of the 18 industries in the 2012 and 2013 Temkin Trust Ratings improved over last year’s scores. The only four industries with declining ratings are TV service providers, retailers, appliance makers, and insurance carriers.
Calculating the Temkin Trust Ratings
During January 2013, Temkin Group asked consumers to identify companies that they have interacted with during the previous 60 days. For a random subset of those companies, consumers are asked to rate companies as follows:
To what degree do you TRUST that these companies will take care of your needs?
Responses from 1= “do not trust at all” to 7= “completely trust”
For all companies with 100 or more consumer responses, we calculated the “net trust” score. The Temkin Trust Ratings are calculated by taking the percentage of consumers that selected either “6” or “7” and subtracting the percentage of consumers that selected either “1,” “2,” or “3.”
Download entire dataset for $295
To see all of the companies in the Temkin Trust Ratings as ell as all of our other Temkin Ratings and sort through the results, visit the Temkin Ratings website
The bottom line: Without a customer’s trust, it’s hard to expect her loyalty.
Filed under 2013 Temkin Ratings, Customer experience
Tagged with 21st Century, 7-Eleven, A credit union, AAA, Ace Hardware, Acer, Activision, Adobe, Advance Auto Parts, Advantage, Aetna, AirTran Airways, ALamo, Alaska Airlines, Albertsons, Aldi, Allstate, Amazon.com, American Airlines, American Express, American Family, Ameriprise Financial, Anthem (BCBS), AOL, Apple, Apple Store, Arby's, AT&T, AutoZone, Avis, Bank Of America, Barnes & Noble, Bed Bath & Beyond, Best Buy, Best Western, BJs Wholesale Club, Blackboard, Blue Shield of California, BMW, Bosch, bright House Networks, Budget, Burger King, Cablevision, Capital One, CareFirst (BCBS), Charles Schwab, Charter Communications, Chase, Chevrolet, Chick-fil-A, Chrysler, Cigna, Citibank, Citigroup, Citizens, Comcast, Comfort Inn, Compaq, Continental Airlines, Costco, Courtyard By Marriott, Coventry Health Care, Cox Communications, Crowne Plaza, CVS, Dairy Queen, Days Inn, Dell, Delta / Northwest Airlines, DirecTV, Discover, Dish Network / EchoStar, Dodge, Dollar, Dollar General, Domino's, Dunkin' Donuts, E*Trade, Earthlink, Edward Jones, Electrolux, eMachines, Empire BCBS, Enterprise, Fairfield Inn, Farmers, FedEx, Fidelity Investments, Fifth Third, Food Lion, Ford, Gateway, GE, Geico, Giant Eagle, Google, H.E.B, Hampton Inn, Hardees, Health Net, Hertz, Hewlett-Packard, Highmark BCBS, Hilton, Holiday Inn, Holiday Inn Express, Honda, HSBC, Humana, Hy-Vee, Hyatt, Hyundai, ING Direct, Intuit, Jack in the Box, JetBlue Airlines, Kaiser Permanente, KFC, Kia, Kroger, La Quinta, Lenovo, LG, Liberty Mutual, Little Caesar's, Marriott, McAfee, McDonalds, Med, Medicaid, Merrill Lynch, MetLife, MetroPCS, Microsoft, Morgan Stanley Smith Barney, Motel 6, MSN (Microsoft Network), Nationwide, Nissan, Optimum (iO) / Cablevision, Piggly Wiggly, Pizza Hut, PNC, Progressive, Publix, Quiznos, Qwest, Regions, Road Runner, S, Safeway, Samsung, Save-a-Lot, Scottrade, ShopRIte, Sonic Drive-In, Sony, Southwest Airlines, Sprint, Starbucks, State Farm, Stop & Shop, SunTrust Bank, Symantec, T-Mobile, TD Ameritrade, TD Bank, The Hartford, Time Warner Cable, Toshiba, Toyota, TracFone, Trader Joe's, Travelers, U.S. Bank, U.S. Cellular, U.S. Postal Service, United Airlines, UPS, US Airways, USAA, Verizon, Verizon Wireless, Virgin Mobile, Wells Fargo, Whirlpool, Whole Foods, Winn-Dixie
All companies, even customer experience leaders, make mistakes. But how much goodwill have companies built up for consumers to forgive them after those miscues? To answer this question, Temkin Group surveyed 10,000 U.S. consumers about companies with whom they’ve recently interacted. We used this data for the third annual Temkin Forgiveness Ratings of 246 companies across 19 industries.
Download entire dataset for $295
Company Results
Here are the highlights of the 246 companies in the 2013 Temkin Forgiveness Ratings:
- Advantage earns top spot. With an excellent score of 61%, Advantage earned the highest rating.
- USAA dominates forgiveness. USAA grabbed the next three spots for its banking, insurance, and credit card businesses.
- The rest of the top 10. H.E.B., Blackboard, Aldi, Alaska Airlines, credit unions and Publix round out the top 10
- No industry owns the top. The top 25 companies in the ratings comes form a variety of industries: Four grocery chains, three airlines, three retailers, two banks, two hotel chains, two investment firms, two software firms, one appliance maker, one auto dealer, one credit card issuer, one fast food chain, one health plan, one insurance carrier, and one rental car agency.
- HSBC dominates the bottom. HSBC earned the bottom two spots in the ratings for its credit card and banking businesses.
- Many TV service providers are at the bottom. Six of the bottom 12 companies are TV service providers: Cox Communications, Time Warner Cable, Comcast, Verizon, Charter Communications, and Optimum (iO)/Cablevision.
- USAA most outperforms its peers. We compared company ratings with their industry averages and USAA came in the top three spots, 36 points above in banking, 31 points ahead in credit cards, and 28 points ahead in insurance. Three other companies are more than 20 points above their industry averages: Advantage (car rentals), credit unions (banking), and TriCare (health plans).
- HSBC most underperforms. HSBC fell the farthest below its industry average in two areas, 23 points behind its peers in banking and credit cards. Five other companies had scores that were 15 points and more below their industry: US Airways (airlines), Motel 6 (hotels), McAfee (software), Kia (auto dealers), and Hertz (rental cars).
We also examined year-over-year results for 204 companies that were in both the 2012 and 2013 Temkin Forgiveness Ratings. Here are some highlights of that analysis:
- Chrysler improves the most. With a jump of 29 percentage points, Chrysler is the most improved company. Six other companies gained 20 points or more: Continental Airlines, Citigroup, Avis, EarthLink, Ameriprise Financial, and Alaska Airlines.
- US Cellular declines the most. With a drop of nearly 20 percentage points, US Cellular dropped the most in 2013. Nine other companies fell by more than 10 points: Bright House Networks, HSBC, Cox Communications, Hertz, PNC, SunTrust Bank, Dollar Rental Car, Hyatt, and TD Ameritrade.
Industry Results
Here are the highlights of the 19 industries in the 2013 Temkin Forgiveness Ratings:

- TV service providers are unforgivable. TV service providers, as an industry, earned the lowest Temkin Forgiveness Rating of 12%. It was five points below Internet service providers and seven points below wireless carriers.
- Grocery chains are the most forgivable. With an average rating of 39%, grocery chains are the highest scoring industry. Three industries are just four points behind: hotel chains, auto dealers, and rental car agencies.
- Credit cards make the most improvements. Credit cards made the largest improvement, nine percentage points, over the previous year. Auto dealers, rental car agencies, and airlines also improved by more than five points.
- TV service providers head in the wrong direction. Led by TV service providers that dropped three points between 2012 and 2013, three industries earned lower scores in 2012. The other industries are retailers and appliance makers.
Calculating the Temkin Forgiveness Ratings
During January 2013, Temkin Group asked consumers to identify companies that they have interacted with during the previous 60 days. For a random subset of those companies, consumers are asked to rate companies as follows:
How likely are you to forgive these companies if they deliver a bad experience?
Responses from 1= “extremely unlikely” to 7= “extremely likely”
For all companies with 100 or more consumer responses, we calculated the “net forgiveness” score. The Temkin Forgiveness Ratings are calculated by taking the percentage of consumers that selected either “6” or “7” and subtracting the percentage of consumers that selected either “1,” “2,” or “3.”
Download entire dataset for $295
To see all of the companies in the Temkin Forgiveness Ratings as ell as all of our other Temkin Ratings and sort through the results, visit the Temkin Ratings website
The bottom line: Forgiveness is an asset that you accumulate by consistently meeting customer needs.
Filed under 2013 Temkin Ratings, Customer experience
Tagged with 21st Century, 7-Eleven, A credit union, AAA, Ace Hardware, Acer, Activision, Adobe, Advance Auto Parts, Advantage, Aetna, AirTran Airways, ALamo, Alaska Airlines, Albertsons, Aldi, Allstate, Amazon.com, American Airlines, American Express, American Family, Ameriprise Financial, Anthem (BCBS), AOL, Apple, Apple Store, Arby's, AT&T, AutoZone, Avis, Bank Of America, Barnes & Noble, Bed Bath & Beyond, Best Buy, Best Western, BJs Wholesale Club, Blackboard, Blue Shield of California, BMW, Bosch, bright House Networks, Budget, Burger King, Cablevision, Capital One, CareFirst (BCBS), Charles Schwab, Charter Communications, Chase, Chevrolet, Chick-fil-A, Chrysler, Cigna, Citibank, Citigroup, Citizens, Comcast, Comfort Inn, Compaq, Continental Airlines, Costco, Courtyard By Marriott, Coventry Health Care, Cox Communications, Crowne Plaza, CVS, Dairy Queen, Days Inn, Dell, Delta / Northwest Airlines, DirecTV, Discover, Dish Network / EchoStar, Dodge, Dollar, Dollar General, Domino's, Dunkin' Donuts, E*Trade, Earthlink, Edward Jones, Electrolux, eMachines, Empire BCBS, Enterprise, Fairfield Inn, Farmers, FedEx, Fidelity Investments, Fifth Third, Food Lion, Ford, Gateway, GE, Geico, Giant Eagle, Google, H.E.B, Hampton Inn, Hardees, Health Net, Hertz, Hewlett-Packard, Highmark BCBS, Hilton, Holiday Inn, Holiday Inn Express, Honda, HSBC, Humana, Hy-Vee, Hyatt, Hyundai, ING Direct, Intuit, Jack in the Box, JetBlue Airlines, Kaiser Permanente, KFC, Kia, Kroger, La Quinta, Lenovo, LG, Liberty Mutual, Little Caesar's, Marriott, McAfee, McDonalds, Med, Medicaid, Merrill Lynch, MetLife, MetroPCS, Microsoft, Morgan Stanley Smith Barney, Motel 6, MSN (Microsoft Network), Nationwide, Nissan, Optimum (iO) / Cablevision, Piggly Wiggly, Pizza Hut, PNC, Progressive, Publix, Quiznos, Qwest, Regions, Road Runner, S, Safeway, Samsung, Save-a-Lot, Scottrade, ShopRIte, Sonic Drive-In, Sony, Southwest Airlines, Sprint, Starbucks, State Farm, Stop & Shop, SunTrust Bank, Symantec, T-Mobile, TD Ameritrade, TD Bank, The Hartford, Time Warner Cable, Toshiba, Toyota, TracFone, Trader Joe's, Travelers, U.S. Bank, U.S. Cellular, U.S. Postal Service, United Airlines, UPS, US Airways, USAA, Verizon, Verizon Wireless, Virgin Mobile, Wells Fargo, Whirlpool, Whole Foods, Winn-Dixie


