Report: The Four Customer Experience Core Competencies (Free)

If you are only going to read only one thing about customer experience, then this report is it. It’s the blueprint for building a customer-centric organization… and it’s free.

We just published a Temkin Group report, The Four CX Core Competencies. This blueprint to building a customer-centric organization is an update to our groundbreaking research that was originally published in 2010 and updated in 2013.

Temkin Group has conducted multiple large-scale studies demonstrating that customer experience (CX) is highly correlated with loyalty across many different industries, in both business-to-consumer and business-to-business environments. When customers have a good experience with a company, they are more likely to repurchase from the company, try its new offerings, and recommend it to others.

While many companies try to improve their CX by making superficial changes, Temkin Group has found that the only path to lasting differentiation and increased loyalty is to build a customer-centric culture. Temkin Group has studied hundreds of companies to uncover the difference between CX leaders and their less successful peers, and has identified four CX competencies that companies must master if they wish to build and sustain CX differentiation:

  1. Purposeful Leadership: Operate consistently with a clear set of values. (see video)
  2. Compelling Brand Values: Deliver on your brand promises to customers. (see video)
  3. Employee Engagement: Align employees with the goals of the organization. (see video)
  4. Customer Connectedness: Infuse customer insight across the organization. (see video)

Download report for FREE

This whiteboard video describes the Four CX Core Competencies:

Here are the best practices described in the report:

Download report for FREE

Consumer Emotions To Health Plans Differ Across Age Groups

In a recent post, Temkin Group analyzed 10 emotions that consumers feel after completing a number of different interactions. We decided to dig deeper into one of those interactions, researching a health plan. We analyzed the emotional responses across different ages of consumers after that interaction and found that:

  • Consumers who are 44-years-old or younger tend to feel happy
  • Consumers who are 45-to-64 years old tend to feel frustrated
  • Consumers who are 65-years-old and older tend to feel relieved

As you can see in the chart below:

  • 18- to 24-year-olds: The most common emotion of the youngest consumers is happiness, and these young group are the happiest of any age level. They are also the most likely to feel appreciated (along with 35-to-44-year-olds) and angry.
  • 25- to 34-year-olds: This age group is also most likely to feel happy, but are also the group that is most likely to feel excited, worried, and confused.
  • 35- to 44-year-olds: This age group is also most likely to feel happy and is also the most likely (along with the youngsters) to feel appreciated.
  • 45- to 54-year-olds: This age group is by far the most likely to feel frustrated and is the most frustrated of any age group. They are also the most likely to feel disappointed.
  • 55- to 64-year-olds: This age group is most likely to feel frustrated and are also the age group that is least likely to feel happy or appreciated.
  • 65-years-old or older: The most common emotion of the oldest consumers is feeling relieved, and they are the most relieved of any consumers. They are also the most likely to feel confident. In addition, they are the least likely to feel angry, excited, confused, or frustrated.

Why is this important? Our research shows that emotion is the largest driver of customer loyalty. So companies must not only start talking about emotion, but they also need to develop unique approaches for dealing with different emotions across their customer segments.

The bottom line: It’s time to make customer emotion a top priority.

Report: Humanizing Digital Interactions

We just published a Temkin Group report, Humanizing Digital Interactions.

Emotions play an integral role in how customers make decisions and form judgments. This means that how a customer feels about an interaction with a company has an enormous impact on his or her loyalty to that company. However, companies tend to ignore customer emotions, especially during digital interactions, which is problematic as customers are increasingly interacting with companies online. This report focuses on humanizing digital interactions by replicating the elements of strong human conversations.

Here are some highlights:

  • We developed The Human Conversational Model, which is made up of seven elements – Intent Decoding, Contextual Framing, Empathetic Agility, Supportive Feedback, Basic Manners, Self-Awareness, and Emotional Reflection.
  • We share over 35 examples of best practices from companies that are designing digital experiences across the seven elements of The Human Conversational Model.
  • We demonstrate how you could apply The Human Conversational Model to three types of digital activities: opening a new bank account online, purchasing a pair of shoes through an app, and getting technical support online.

Download report for $195
BuyDownload3

A gratifying conversation requires two processes:

  • Cooperative Interface. Each participant is required to collaborate with her partner to achieve the shared goal of the conversation – be that casually catching up, gathering information, sharing knowledge, etc. This is the part of the model that a conversational partner sees and responds to, and it consists of five elements: contextual framing, intent decoding, empathetic agility, supportive feedback, and basic manners.
  • Background Mindfulness. This portion of the model is not observable within what would normally be considered the scope of the conservation as it pertains to what happens internally within person. Each participant has a pre-existing notion of who he is as an individual (self-awareness) and throughout the course of the conversation, learns about how he affects other people (emotional reflection). Though not directly observable, “background mindfulness” informs the way in which each participant communicates with his current and future partners.

Here’s an overview of the Human Conversation Model along with best practices we highlight in the report:

Download report for $195
BuyDownload3

Examining 10 Emotions, 8 Interactions, and Resulting Loyalty

Any regular reader of this blog likely knows that emotion is a key topic for Temkin Group. We labelled 2016 as The Year of Emotion and operationalizing emotion is one of our 2017 CX trends.

As part of our push to drive more detailed discussions about emotion, we examined the emotions that consumers feel after specific interactions. It turns out that different interactions lead to a variety of emotions which have differing loyalty effects.

The chart below shows 10 emotions that 10,000 consumers selected to describe how they felt after completing eight interactions.

As you can see above:

  • Most interactions lead to positive emotions, as the four most prevalent emotions on our list are Happy, Excited, Relieved, and Confident.
  • Happy and Excited are the most common emotions.
  • Purchasing a new pair of shoes leads to the most frequent emotion, Happy.
  • Researching a health insurance plan doesn’t create any consistent emotional response, as the most common emotion (Relieved) was selected by less than one-third of consumers.
  • Investigating a mistake in a monthly bill is the interaction that most frequently leads to Angry and Frustrated.
  • Filing a claim with a home or auto insurance company is the interaction that most frequently leads to Appreciated and Worried.
  • Researching a hotel or rental car for a trip is the interaction that most frequently leads to Confident.
  • Researching a health plan is the interaction that most frequently leads to Confused and Disappointed.
  • Using a new mobile phone or tablet for the first time is the interaction that most frequently leads to Excited.
  • Reaching out for technical support for a computer is the interaction that most frequently leads to Relieved.

We also looked at the loyalty that consumers have to companies based on the emotions that they’ve experienced. The chart below examines the loyalty for each of the 10 emotions averaged across all eight interactions (I’ll examine interaction-specific data in a future post):

As you can see:

  • Excited and Appreciated lead to the most loyalty.
  • Disappointed leads to the worst loyalty profile.
  • The lack of any of these emotions leads to less of both loyalty and disloyalty.

The bottom line: Focus on the specific customer emotions you’re creating.

Emotion and the Four Customer Experience Core Competencies

If you’ve followed our research, then you know that organizations build and sustain customer-centric cultures by mastering the Four CX Core Competencies: Purposeful Leadership, Compelling Brand ValuesEmployee Engagement, and Customer Connectedness.

1610ultimate_master4competencies

You also know that we’ve called 2016 The Year of Emotion, and have been trying to raise the visibility of this key area with out Intensify Emotion efforts.

IntensifyEmotionWidget2

Hopefully you recognize that emotion is a critical component of customer experience. To further deepen that thinking, here’s some advice for infusing emotion across all of the competencies:

1612_emotionacross4cxcompetencies

Want Loyal Customers? Start Talking About Their Emotions!

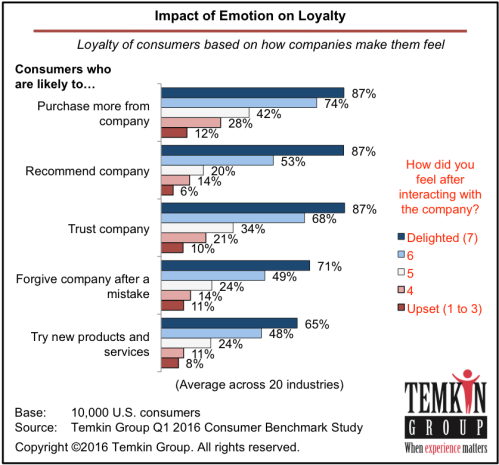
Did you know that customers who feel adoring after an experience are more than 11 times as likely to buy more from a company than customers who feel angry? And customers who feel appreciative are more than 5 times as likely to trust a company than those who feel agitated?

That’s because how customers feel about an interaction has a significant impact on their loyalty to a company. So let’s talk about emotions.

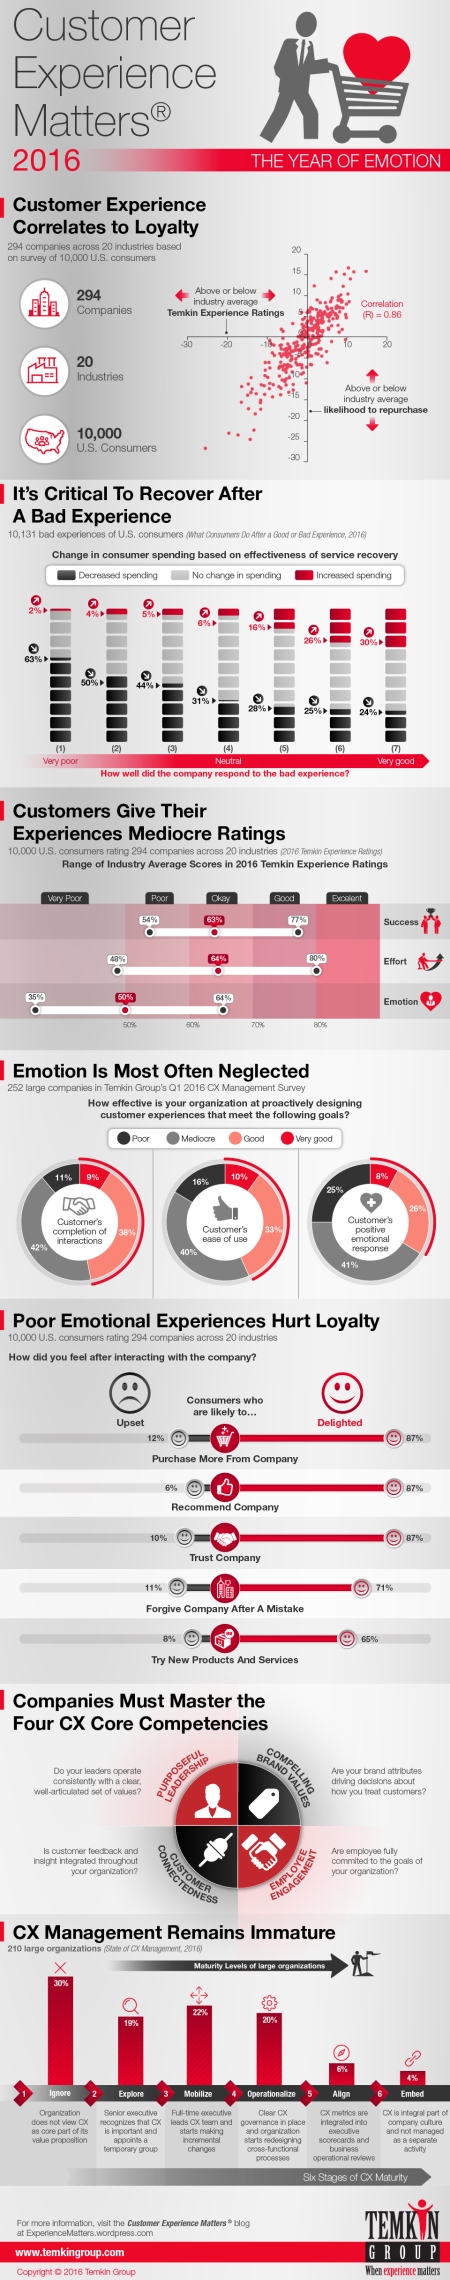
Despite the importance of customer emotions, they are all too often neglected (or outright ignored) inside of companies. As a result of this negligence, consumers give their providers very low emotion scores in our Temkin Experience Ratings.

It’s time to start talking about emotions. To help spur this dialogue, we introduced a new vocabulary that we call the Five A’s of an Emotional Response.

1612_5asofemotionalresponse

Every time a customer interacts with you, they feel one of these A’s:

  • Angry: Customers feel wronged by the interaction and will look for opportunities to tell other people (a.k.a. vent) about the situation. They will try to stay away from the organization.
  • Agitated: Customers didn’t enjoy the interaction and will think twice about doing business with the organization in the future.
  • Ambivalent: Customers had no significant emotional response and will remain as loyal as they were before the interaction.
  • Appreciative: Customers feel that the organization outperformed their expectations and are more inclined to do business with the organization in the future.
  • Adoring: Customers feel like company fully met their needs and will look for opportunities to tell other people about the situation. They will try to interact more with the organization in the future.

If you’re still wondering why you might want to talk about the Five A’s, here’s some data that will hopefully entice you to increase your emotion vocabulary. We analyzed the loyalty of 10,000 U.S. consumers based on the Five A’s of their emotional response to interactions across 20 industries – more than 100,000 overall interactions in total.

1612_loyaltyoffiveasofemotion

As you can see above, the Five A’s aren’t just a set of words, they’re a strong indication of the loyalty of your customers. Compared with those who feel “angry,” customers who feel “adoring” are more than 11 times as likely to buy more, 17 times as likely to recommend the company, 9 times as likely to try new offerings, 6 times as likely to forgive the company if it makes a mistake, and 10 times as likely to trust the company.

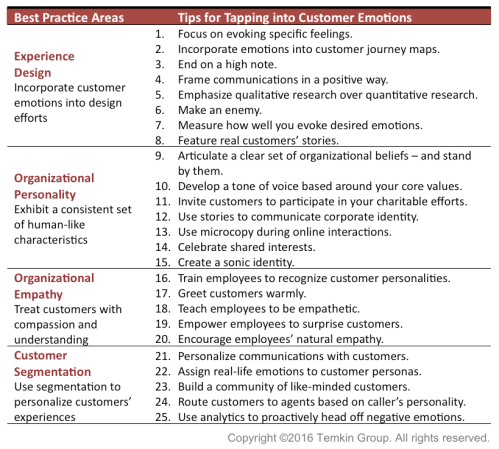
If you are not talking about emotion, then you’re not being purposeful about customer loyalty. Here are some ways that you can start using the Five A’s:

  • Training. If you teach all employees this scale, then your organization will have a common vocabulary for discussing customer reactions. This framework will help trainees gauge how customers would likely respond to situations and discuss what they could do to improve the customer’s ultimate emotional response.
  • Coaching. Supervisors can ask their employees a very simple question after an interaction: “How do you think the customer felt about the call?” This can work for any employee that interacts with customers: phone reps, retail salespeople, cashiers, insurance agents, bank tellers, etc.
  • Designing. When you are creating a new experience (product, process, interaction, etc.), get feedback from customers about how they feel. Internally, you can have discussions like… “Most of the customers were ambivalent, but if we make this change then I think we can make most of them appreciative and even a few of them will be adoring.
  • Tracking customer emotions. Every time employees interact with a customer or make a decision, they can give themselves a score based on what they believe is (or will be) the customers’ most likely emotional response to their action:
    • Angry (-3)
    • Agitated (-1)
    • Ambivalent (0)
    • Appreciative (+1)
    • Adoring (+3)

The total across these interactions and decisions represents a customer delight score. Employees can calculate this score on a regular basis (daily, weekly) and track how well they are doing over time.

Having an emotion vocabulary will hopefully get you to focus more about this critical topic. And if you just start talking about emotion, you will help stimulate employees’ natural empathy. So… start talking about emotion!

The bottom line: Talk about making customers adoring, not angry.

The Demographics of Happiness

1611_demographicsofhappinessTomorrow I will join millions of Americans in celebrating Thanksgiving. Many of us will spend the day with our families devouring turkey, stuffing, and other savory dishes while watching football games. It’s also a great time to actually give thanks.

I have a lot to appreciate; a wonderful family, a great group of friends, a thriving business, an amazing Temkin Group team, and the world’s best clients. As we know from the positive psychology movement, the act of appreciation creates happiness—and all of that makes me very happy.

Given the holiday, I decided to dig into Temkin Group’s Q3 2016 Consumer Benchmark Study and see who’s happy. I analyzed which of the 10,000 U.S. consumers in our study agree with the statement “I am typically happy.”

This first chart shows data from the 27 states where we had at least 100 respondents. As you can see, happiness ranges from a high of 83% in Oregon down to a low of 67% in Wisconsin and Indiana.
1611_hapinessbystate

The next set of charts show the level of happiness across different demographic segments:

  • Genderations: The happiest females are 75 and older, while 65- to 74-year-old males are the happiest (85% say that they are typically happy). 18- to 24-year-olds are the least happy, followed closely by 45- to 54-year-olds. Between the ages of 18 and 44, males are happier than females. Females are happier between 45- and 74-years-old.
  • Education: As the level of education increases, so does happiness. Eighty-five percent of those with an advanced degree are happy, compared with only 60% of those who did not graduate high school.
  • Ethnicity: There’s little variation in happiness across ethnic groups. Caucasians are the happiest (73%), but only three points above African Americans (73%).
  • Income: Only 60% of consumers making less than $25,000 per year are happy. Happiness rises with income until consumers’ household income hits about $100,000, after which happiness plateaus around 86%.
  • Family: Married people are happier. Eighty-four percent of those who are married with young children are happy, followed by married people with older children and with no children at all. The least happy people are those who are not married and do not have kids; only 66% are happy.

Read more of this post

People Aren’t Perfect, Design Around Their Biases

Every day, people are faced with innumerable choices, and methodically weighing the pros and cons of each one is not only unnecessary, it is also mentally draining. In order to ease this cognitive burden, people have evolved two modes of thinking—intuitive thinking and rational thinking—to help us make decisions more efficiently. 1611_2typesofthinking2Intuitive thinking—also known as System 1 thinking—is fast, effortless, automatic, and takes place in our unconscious, while rational thinking—also known as System 2 thinking—is slow, effortful, logical, and takes place consciously. Intuitive thinking actually helps us reach successful conclusions more quickly and economically than rational thinking.

Intuitive thinking relies heavily on existing mental shortcuts—known as heuristics—and on cognitive biases. Heuristics are simple rules of thumb that our brains have evolved to help us reach satisfactory—though not always optimal—decisions swiftly and efficiently. Sometimes, however, heuristics fail and lead to cognitive biases, which are systematic errors in the way we think. For instance, people:

  • Are more affected by losses than by gains. One of the most important underlying principles of human decision-making is called Prospect Theory, which holds that humans do not make decisions based on a rational evaluation of the final outcome, but rather on an unconscious evaluation of the potential gains and losses of each choice.
  • Prefer simplicity over complexity. Biases and heuristics are all about lightening the cognitive load, so it is no surprise that people tend to choose options that are easier to mentally process, even when a more complicated option is actually better.
  • Are affected by current emotional and visceral states. Like cognitive processes, visceral states and emotions play an essential role in helping people make successful choices, but sometimes they can lead to biases. For example, people are more impulsive when they are hungry, thirsty, sexually aroused, or in other heightened states of emotion.
  • Are heavily influenced by those around them. People are naturally social creatures who automatically imitate the actions and mimic the emotions of those around them.
  • Make decisions based on context. Decisions are not made in a vacuum; rather, they are extremely dependent on context. Context can include the physical environment in which a person makes a decision, the unconscious priming effects a person encounters, how a decision is framed, and what other choices are available for comparison.
  • Misjudge their past and future experiences. Our memory is not like a videotape; it does not record every moment of an experience, placing equal emphasis on each second. Instead, it is like a camera, taking snapshots at certain crucial moments and then retroactively judging the experience based on those snapshots.

For more information on how to incorporate these biases into your efforts, see the report Behavioral Guide to Customer Experience Design.

The bottom line: Embrace human biases, don’t ignore them.

Exploring Multiple Emotions During Contact Center Interactions

In a previous post, I discussed results from a joint study that we conducted with Mattersight Personality Labs (MPL) to examine customer emotions within contact center interactions.

MPL isolated the occurrence of four specific emotions: joy, anger, sadness, and fear in more than 118,000 calls across 11 large brands. In addition to detecting the customer emotion, we also analyzed the lengths of the calls, the percentage of calls transferred to other agents or supervisors, and the Net Promoter® Score (NPS®) provided by customers right after their calls.

To normalize the analysis across companies, we divided the data for individual calls by company averages. So a “1.0” is equal to company average.

While the previous post examined the individual emotions, this post looks at the combinations of the four emotions. While less than 1% of callers experienced all four emotions, it happened during more than 650 calls­—more than enough for us to analyze.

1610_emotioncombinations

As you can see in the chart above:

  • Joy plus Fear creates the longest calls. When the calls contain all four emotions, they are almost two and a half times as long as an average call. The next two combinations, which are also more than two times as long as an average call, also contain joy and fear.
  • Multiple emotions create longer calls. The only calls that are shorter than average are those where we could only detect sadness. The next shortest calls were those that only had joy and anger.
  • Anger plus Fear creates the most transfers. When callers exhibit both anger and fear, the calls are transferred at a rate that is seven times the average. The next highest transfers also happen when the caller demonstrates fear.
  • Joy creates the fewest transfers. The three types of calls that have the lowest transfer rates all contain joy, as do six out of seven. The only types of calls without joy that also have below average transfer rates are those that only contain sadness.
  • Joy raises NPS. When a caller feels only joy, the call results in the highest NPS. Joy is also a part of the calls that earn the two next highest NPS.
  • Anger plus other emotions lowers NPS. The lowest NPS occurs whenever anger is combined with another emotion. The worst combination is anger plus sadness.

The bottom line: Anger and fear are terrible emotions to occur on a call.

Start Talking About Emotions (Video)

To help celebrate “The Year of Emotion” on CX Day (and beyond), Temkin Group created this fun, short video: Start Talking About Emotion.

The bottom line: Add the Five A’s of an Emotional Response to your vocabulary

Free eBook: 25 Tips For Tapping Into Customer Emotions

1609_ebook_25emotiontips_finalAs part of our CX Day celebration, we’re giving away this free eBook: 25 Tips For Tapping Into Customer Emotions.

Here’s the executive summary:

Emotions play an essential role in how people form judgments and make decisions. Consequently, a customer’s emotional response to an experience with a company has a significant impact on their loyalty to that company. To help you improve your customer experience, we’ve compiled a list of 25 examples from companies who are tapping into customer emotions, which you can emulate at your own organization.

FreeDownloadButton

The eBook contains 25 tips across four areas: Experience Design, Organizational Personality, Organizational Empathy, and Customer Segmentation.

1610_25emotiontips

The bottom line: Apply these lessons to tap into your customers’ emotions

The Ultimate Customer Experience Infographic, 2016

Once again, Temkin Group is publishing a new infographic as part of our CX Day celebration.

1610_cxmattersinfographic

Take a look at last year’s ultimate CX infographic.

Here are links to download different versions of the infographic:

1610_cxmattersinfographic Infographic: in .jpg format, in .pdf format

1610_cxmattersinfographic_poster 18″ x 24″ poster: in .jpg format, in .pdf format


Customer Emotions (Joy, Anger, Sadness, and Fear) Affect Contact Center Interactions

As you may know, Temkin Group labeled 2016 “The Year of Emotion” in its annual listing of customer experience trends. Why? Because emotion drives loyalty. And yet, despite its significant impact on customer loyalty, organizations do not focus on emotion enough. So to help increase organizations’ awareness of this critical area of customer experience, we created the Intensify Emotion Movement.

As part of our efforts to bring emotion to forefront of CX discussions, we worked with Mattersight Personality Labs to examine customer emotions within contact center interactions, a notorious hotbed of customer discontent. Analysts at Mattersight did the heavy lifting, applying the company’s analytical models to more than 118,000 calls across 11 large brands. While customers experience multiple emotions during every call, for this analysis we isolated the occurrence of four specific emotions: joy, anger, sadness, and fear.

Temkin Group and Mattersight Personality Labs collectively analyzed the results of this work. In addition to detecting customers’ emotions, we also analyzed the lengths of the calls and the Net Promoter® Score (NPS®) provided by customers right after their calls. [Why NPS? Because we had the data.]

To normalize the data across companies, we divided the data for individual calls by company averages. So a “1.0” is equal to company average.

06_Call-Experience_v02

The chart above captures some of the key findings:

  • Joy leads to best calls. No surprise, the only positive emotion we examined results in the highest NPS, the shortest calls, and the least frequent call transfers. Interestingly, the calls where we detected joy are actually slightly longer than average (although well less than the other three emotions). While we didn’t analyze the exact reasons why this happens, it could be caused by the willingness of the caller and agent to take a bit more time conversing when the customer feels happier and more friendly.
  • Fear leads to most expensive calls. In instances when customers felt detectably fearful, the call time jumps to 87% higher than company average, by far the longest of any emotion. In these calls, we also found that the caller was transferred to another agent or supervisor more than 3.5-times as frequently as the company average. The NPS drops lower than average as well.
  • Anger leads to lowest NPS. When customers experience anger, they give the lowest NPS (19% below company average). The calls are also 40% longer than average and are more than twice as likely to be transferred.
  • Sadness leads to low NPS. Customers who experience sadness give companies an NPS that is only slightly higher than the one they give when they are angry (18% below company average).

Additional Findings

Here are some additional findings from the research:

Read more of this post

2016 Temkin Emotion Ratings (Publix, Chick-fil-A, and Residence Inn Are the Leaders)

For the previous five years, we’ve measured emotion as part of the Temkin Experience Ratings (TxR). This year, we examined 294 companies across 20 industries based on a survey of 10,000 U.S. consumers (see methodology section below). The TxR examines the three elements of customer experience: success, effort, and emotion. In this post, I examine the results for the Temkin Emotion Ratings.

Emotion is the component of customer experience that is the most significant driver of customer loyalty. And we showed the connection between emotion and loyalty in a recent post. To find out more about how you can tap into the power of customer emotions, visit the Intensify Emotion Movement.

Publix, Chick-fil-A, and Residence Inn earned the only “good” scores for delivering the most positive emotional experiences, followed closely by H-E-B, True Value, Kroger, Save-a-Lot, Wawa Food Market, QVC, and Amazon.

At the other end of the emotional spectrum, the companies with the lowest Ratings are Comcast (for both Internet service and TV service), Fujitsu, Health Net, Blue Shield of CA, Anthem, Time Warner Cable, Commonwealth Edison, Medicaid, Charter Communications, and AT&T.

1609_temotr_leaderslaggards

Do you want to the data from the 2016 Temkin Effort Ratings? It’s included in the Temkin Experience Ratings spreadsheet that you can purchase for $395.
Here’s a sample of the spreadsheet (.xls)

Here are some additional insights from the 2016 Temkin Emotion Ratings:

  • The supermarket and fast food industries earned the highest average Temkin Emotion Ratings (at “okay” level), while health plans, TV service providers, and Internet providers were at the bottom with “very poor” ratings.
  • The following companies earned ratings that are the most above their industry averages: Amazon, Residence Inn, Florida Power & Light, TXU Energy, National Car Rental, and Alabama Power Company.
  • The following companies earned ratings that are the farthest below their industry averages: Fujitsu, Motel 6, Super 8, Chrysler, Volkswagen, Commonwealth Edison, and Citibank.
  • The following companies earned the largest improvement between the 2015 and 2016 Ratings: Coventry Health Care, True Value, Con Edison of NY, Consumers Energy Company, Dominion Virginia Power, and Fox Rent A Car.
  • The following companies declined the most between 2015 and 2016: Volkswagen, Fujitsu, Commonwealth Edison, BMW, GM, Health Net, and JetBlue.

Read more of this post

The (Large) Connection Between Emotion And Loyalty

In case you missed it, we labeled 2016 as The Year of Emotion in our annual listing of CX trends. To help organizations better understand customer emotions, we created the Intensify Emotion Movement. Why did we put so much of a focus on emotion? Because it drives loyalty.

We tapped into our recent consumer benchmark study to examine the connection between how consumers rate the emotional component of their interactions and their loyalty across 20 industries. [Note: The emotional data is from the emotion component of the Temkin Experience Ratings]

In the graphic below, we examined the average across all 20 industries. Compared with consumers who had negative emotional experience, consumers who had positive emotional experiences are:

  • 15.1 times more likely to recommend the company
  • 8.4 times more likely to trust the company
  • 7.8 times more likely to try new products and services
  • 7.1 times more likely to purchase more from company
  • 6.6 times more likely to forgive company after a mistake

1608_EmotionAndLoyalty

If you’d like to see this data for each of the 20 industries, you can purchase and download the dataset for $195. To see what you’ll be purchasing, download this sample spreadsheet.

BuyDownload3

The bottom line: Want loyal customers? Provide positive emotional experiences.