Report: What Happens After a Good or Bad Experience, 2017

We just published a Temkin Group report, What Happens After a Good or Bad Experience, 2017. This is our annual analysis of which companies deliver the most and least bad experiences, how consumers respond after those experience (in terms of sharing those experiences and changing their purchase behaviors), and the effect of service recovery (see last year’s report).

Here’s the executive summary:

To understand how good and bad experiences effect customer behavior, we asked 10,000 U.S. consumers about their recent interactions with more than 300 companies across 20 industries. We then compared results with similar studies we’ve conducted over the previous six years. Here are some highlights:

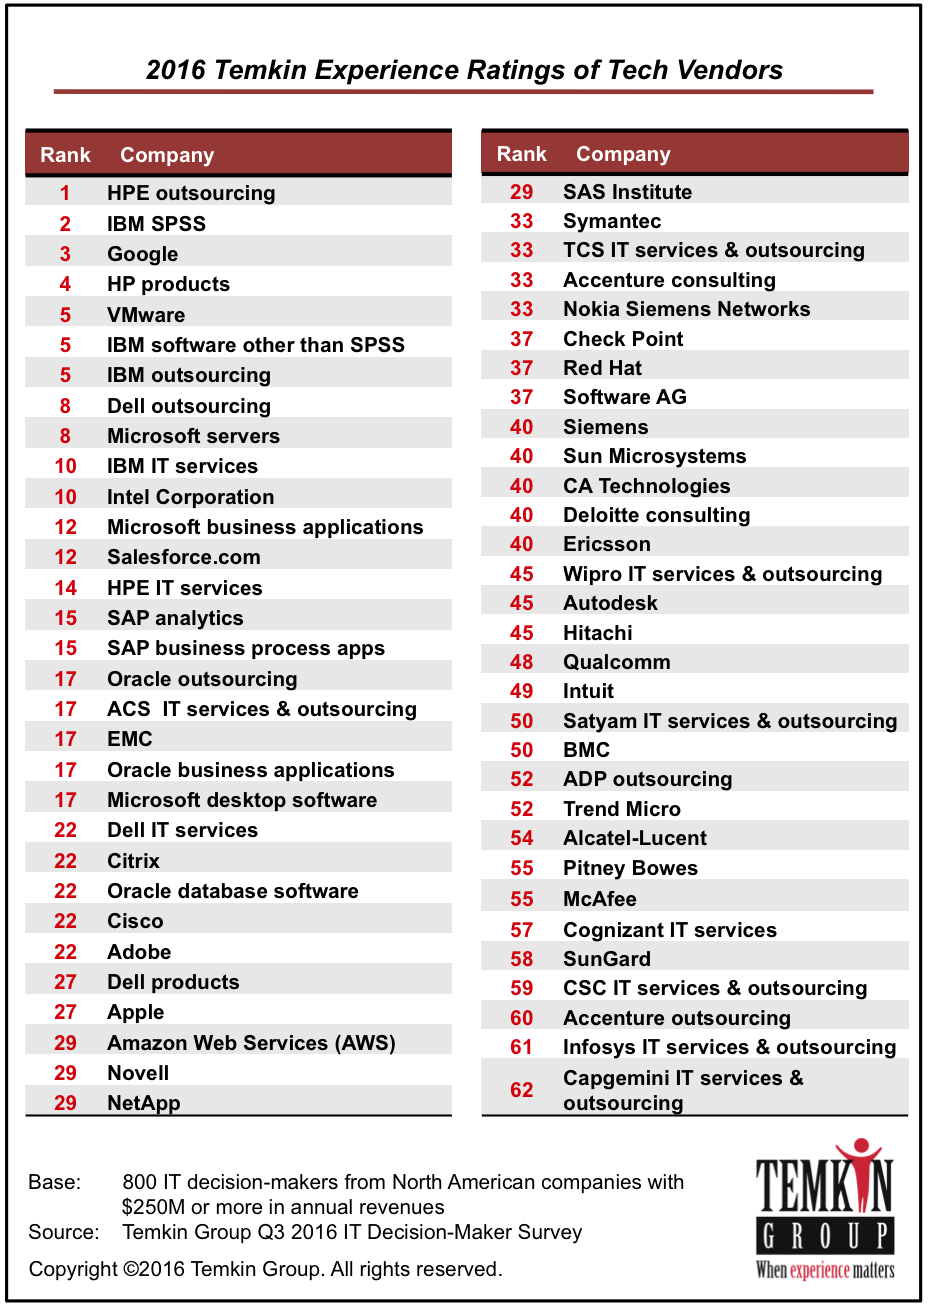
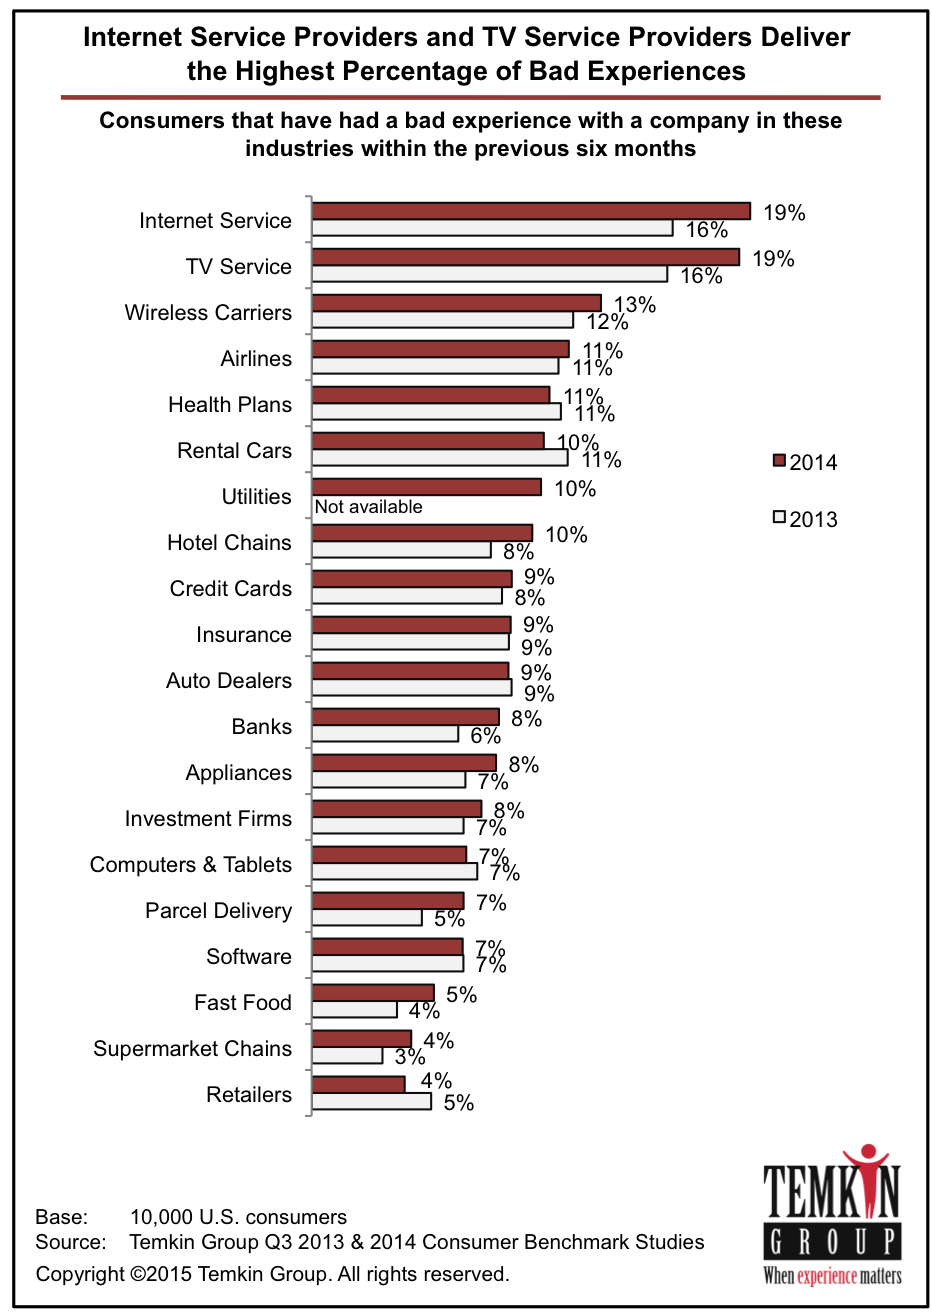
  • About 19% of the customers who interacted with Internet service providers and TV service providers reported having a bad experience – a considerably higher percentage than in other industries. Of the companies we evaluated, 21st Century, Spirit Airlines, and HSBC deliver bad experiences most frequently.
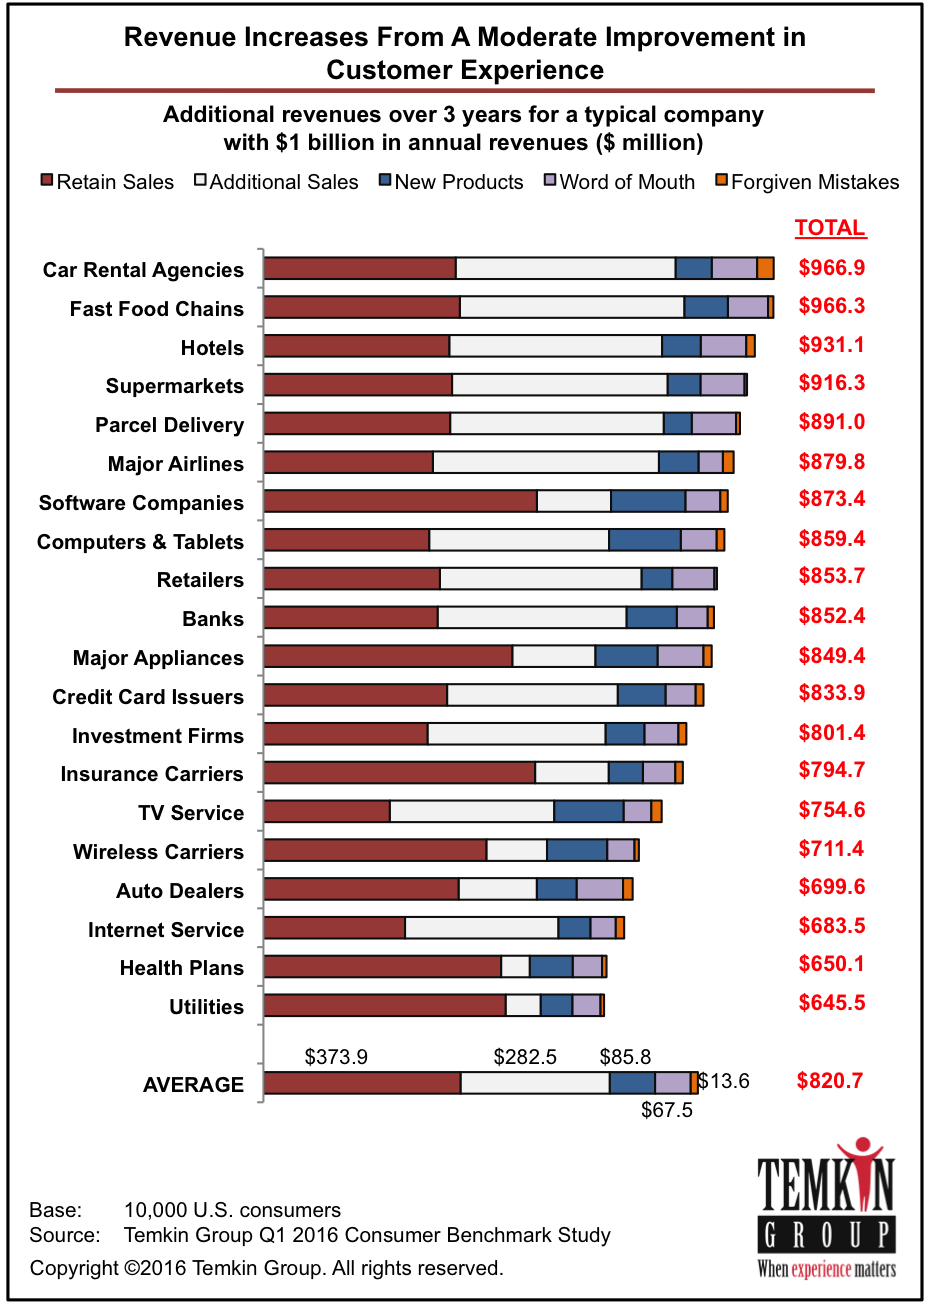
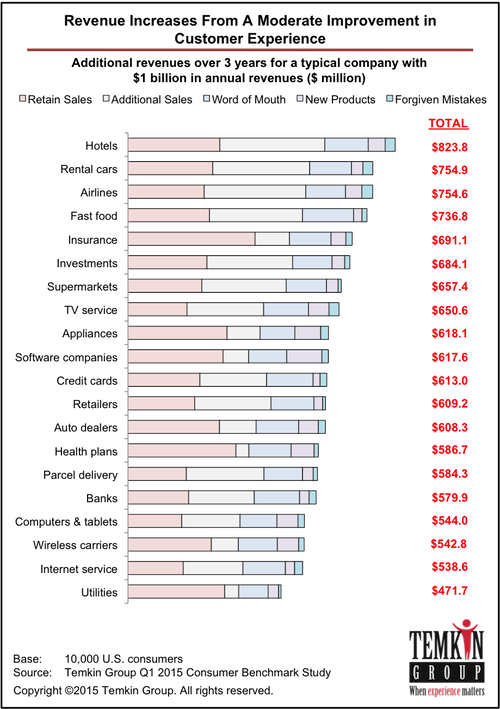
  • We looked at the percentage of customers in an industry had a bad experience and combined that number with the percentage of customers who said they decreased their spending after a bad experience and then used this data to create a Revenues at Risk Index for all 20 industries. Rental car agencies stand to lose the most revenue (6.7%) from delivering bad experiences, while retailers stand to lose the least (1%).
  • Investment firms are most effective at recovering after a bad experience, whereas TV service providers are the least effective.
  • After customers have a very bad or very good experience with a company, they are more likely to give feedback directly to the company than they are to post about it on Facebook, Twitter, or third party rating sites. Customers are also more likely to share positive feedback through online surveys and share negative feedback through emails.
  • Compared to previous years, customers are more likely to share feedback over Facebook and Twitter, and these channels are most popular with consumers who are between 25- and 44-years-old.
  • Of all the companies we evaluated, The Hartford is the most likely to receive negatively biased feedback directly from its customers, while Chubb is likely to receive the most positively biased feedback.

Download report for $195
BuyDownload3

Here are excerpted versions of 3 (out of 19) graphics in the report:
Read more of this post

Report: 2016 Temkin Experience Ratings of Tech Vendors

1610_temkinexperienceratingstechvendors_coverWe just published a Temkin Group report 2016 Temkin Experience Ratings of Tech Vendors that rates the customer experience of 62 large tech vendors based on a survey of 800 IT decision makers from large North American firms. This is the fifth year of the ratings, here are links to the 2012, 20132014, and 2015 ratings.

Here is the executive summary of the report:

The 2016 Temkin Experience Ratings of Tech Vendors evaluates the customer experience of 62 large technology vendors. We surveyed 800 IT decision-makers from large companies regarding three components – success, effort, and emotion – of their experiences with these IT providers. Out of all the vendors we looked at, HPE outsourcing, IBM SPSS, and Google earned the highest ratings, while Capgemini, Infosys, and Accenture received the lowest ratings. The average score for the Ratings dropped by one percentage-point over the past year, down from 59% in 2015 to 58% this year. Furthermore, our research shows that the Temkin Experience Ratings are strongly correlated with multiple elements of loyalty behavior, including likelihood of repurchasing from the company, likelihood of recommending the company, likelihood of trying new products, and likelihood of forgiving the company if it makes a mistake.

This product has a report (.pdf) and a dataset (excel). The dataset has the details of the 2016 Temkin Experience Ratings, including all three components, for the 62 tech vendors as well as data on customers’ likelihood to repurchase from the vendors, their 2016 Temkin Forgiveness Ratings, and their 2016 Temkin Innovation Equity Quotient. It also includes a summary of the 2015 Temkin Experience Ratings, likelihood to repurchase, and Temkin Forgiveness Ratings.

Download for $695, includes report (.pdf) and data file (.xls)
BuyDownload3

The Temkin Experience Ratings of Tech Vendors evaluates three areas of customer experience: success (can customers achieve what they want to do), effort (how easy is it for customers to do what they want to do), and emotion (how do customers feel about their interaction). Here are the overall results:

1610_techvendortxr_companies

Read more of this post

Report: ROI of Customer Experience, 2016

1610_roiofcx_coverWe published a Temkin Group report, ROI of Customer Experience, 2016. This research shows that CX is highly correlated to loyalty across 20 industries. Here’s the executive summary:

To understand the connection between customer experience (CX) and loyalty, we examined feedback from 10,000 U.S. consumers that describes both their experiences with and their loyalty to different companies. To examine the CX component, we used the 2016 Temkin Experience Ratings (TxR), which evaluated 294 companies. Our analysis shows that there’s a very large correlation between companies’ TxR and the willingness of customers to purchase more from them. This connection holds true for other areas of customer loyalty as well. We used this data to calculate the revenue impact of CX across 20 industries. We found that a moderate increase in CX generates an average revenue increase of $823 million over three years for a company with $1 billion in annual revenues. Rental car agencies have the most to gain from improving CX ($967 million), while utilities have the least to gain ($645 million). While all three components of customer experience¬—success, effort, and emotion—have a strong effect on loyalty, our research shows that emotion is the most important element. When compared with companies with very poor CX, companies with very good CX have a 16.7 percentage-point advantage in customers who are willing to purchase more from them, 16.7 percentage-point advantage in customers who trust them, 10.3 percentage-point advantage in customers willing to forgive them if they make a mistake, and 7.1 percentage-point advantage in customers who are willing to try their new products. Additionally, companies with very good CX ratings have an average Net Promoter Score that is 22 points higher than the scores of companies with poor CX. We recommend that you build your own CX ROI models, using our five-step approach for guidance.

Download report for $295
BuyDownload3

This is one of the figures in the report, and it shows the high correlation between Temkin Experience Ratings (customer experience) and purchase intentions for 294 companies across 20 industries:
1610_purchasemorecorrelationgraphHere’s an excerpt from the graphic showing the three year impact on revenues for a $1 billion company in 20 different industries:

1610_roirevsbyindustry

Download report for $295
BuyDownload3

To see the customer experience levels of all 294 companies, download to the free 2016 Temkin Experience Ratings report.

P.S. Net Promoter Score, Net Promoter, and NPS are registered trademarks of Bain & Company, Satmetrix Systems, and Fred Reichheld.

Report: Economics of Net Promoter Score, 2016

1606_EconomicsofNetPromoter_COVERWe just published a Temkin Group report, Economics of Net Promoter, 2016. Here’s the executive summary:

Net Promoter® Score (NPS®) is a popular metric that companies use to analyze their customer experience efforts, but how does it actually relate to loyalty? We asked thousands of consumers to give an NPS to 294 companies across 20 industries, and then we examined the connection between NPS and four key areas of loyalty. We found that compared to detractors, promoters are more than five times as likely to repurchase from companies, more than seven times as likely to forgive companies if they make a mistake, and almost nine times as likely to try new offerings from companies. Our research also shows that promoters recommend a company to an average of 3.5 people. The following analysis provides detailed loyalty data of promoters, passives, and detractors across 20 industries: airlines, auto dealers, banks, computer and tablet makers, credit card issuers, fast food chains, health plans, hotel chains, insurance carriers, Internet service providers, investment firms, major appliance makers, parcel delivery services, rental car agencies, retailers, software firms, supermarkets, TV service providers, utilities, and wireless carriers. Ultimately, if a company wants to benefit from using NPS as a key metric, it must focus on improving customer experience, not obsessing over the metric itself.

Download report for $295
BuyDownload3

Here’s one of the 12 graphics in the report, which shows the average loyalty differences for promoters, passives, and detractors across all industries:NPSEconomicsOverview

The report provides this loyalty data for promoters, passives, and detractors for 20 industries: airlines, auto dealers, banks, computer and tablet makers, credit card issuers, fast food chains, health plans, hotel chains, insurance carriers, Internet service providers, investment firms, major appliance makers, parcel delivery services, rental car agencies, retailers, software firms, supermarket chains, TV service providers, utilities, and wireless carriers.

Download report for $295
BuyDownload3

See our VoC/NPS resource page, which includes great resources for creating a successful NPS program. You mat also want to see our latest NPS Benchmark Report with NPS data on 291 companies.

The bottom line: Promoters are much more valuable than detractors.

Net Promoter Score, Net Promoter, and NPS are registered trademarks of Bain & Company, Satmetrix Systems, and Fred Reichheld.

Report: What Happens After a Good or Bad Experience, 2016

1603_WhatHappensAfterGoodBadExperiences_COVERWe just published a Temkin Group report, What Happens After a Good or Bad Experience, 2016. This is our annual analysis of which companies deliver the most and least bad experiences, how consumers respond after those experience (in terms of sharing those experiences and changing their purchase behaviors), and the effect of service recovery (see last year’s report).

Here’s the executive summary:

We asked 10,000 U.S. consumers about their recent interactions with 315 companies across 20 industries, and compared results with similar studies over the previous five years. More than 20% of the customers of Internet service providers and TV service providers reported a bad experience, considerably above the rates for any other industry. Air Tran Airways, Time Warner Cable (TV service and Internet service), Comcast (TV service), and HSBC delivered bad experience to at least one-quarter of their customers. At the same time, less than 3% of Michael’s, Advance Auto Parts, Whole Foods, Publix, Subway, Vanguard, Trader Joe’s, and GameStop customers report having bad experiences. We examined the combination of the volume of bad experiences and the resulting revenue impact and created a Revenues at Risk Index for all 20 industries. At the top of the list, TV service providers and rental car agencies stand to lose at least 6.5% of their revenue from bad experiences. Conversely, less than 2% of the revenues for retailers and supermarket chains are at risk. The companies that recovered very poorly after a bad experience lost sales from 63% of their customers, more than 2.5 times as many as companies that recovered very well. Companies that do a very good job at recovering after a bad experience have more customers who increase spending than those who decrease spending. After a very bad or very good experience, consumers are more likely to give feedback directly to the company than they are to post on Facebook, Twitter, or third party rating sites. Regardless of the channel, consumers are more likely to discuss a very bad experience than a very good one. While the way that consumers give feedback has not changed much since last year, the volume of Twitter usage grew for both positive and negative experiences. Piggly Wiggly, US Cellular, Fifth Third, The Hartford, TriCare, and PSE&G face the potential for the most negatively biased feedback from customers.

Download report for $195
BuyDownload3

Here are excerpted versions of 4 (out of 15) graphics in the report: Read more of this post

Report: ROI of Customer Experience, 2015

1510_RoIofCX_COVERWe published a Temkin Group report, ROI of Customer Experience, 2015. This research shows that CX is highly correlated to loyalty across 20 industries. Here’s the executive summary:

To understand the connection between customer experience (CX) and loyalty, we examined feedback from 10,000 U.S. consumers that describes both their experiences with and their loyalty to 293 companies across 20 industries. Our analysis shows a strong correlation between customer experience and loyalty factors such as repurchasing, trying new offerings, forgiving mistakes, and recommending the company to friends and colleagues. While all three components of customer experience—success, effort, and emotion—have a strong effect on loyalty, our research shows that emotion is the most important element. When we compared the consumers who gave companies a very good customer experience rating to those who gave companies a very bad customer experience rating, we found that at companies with high customer experience ratings, the percentage of customers who plan on purchasing more is 18 points higher, the percentage who will forgive the company if it makes a mistakes is 12 points higher, the percentage who will try a new offering is 10 points higher, and the percentage who trust the company is 19 points higher. Additionally, companies with very good CX ratings have an average Net Promoter® Score that is 24 points higher than the scores of companies with poor CX. We built a model to evaluate how, over a three-year period, customer experience impacts the revenue of a $1 billion business within each of the 20 industries. This model shows that CX has the largest impact on the revenue of hotels ($823 million) and rental cars ($755 million) over three years. This report also includes a five-step approach for building a model that estimates the value of CX for your organization.

Download report for $295
BuyDownload3

This is the first figure in the report, and it shows the high correlation between Temkin Experience Ratings (customer experience) and purchase intentions for 293 companies across 20 industries:
1510_CXvsRepurchase

Here’s an excerpt from the graphic showing the three year impact on revenues for a $1 billion company in 20 different industries:

1510_ROIRevenues

Download report for $295
BuyDownload3

To see the customer experience levels of all 293 companies, download to the free 2015 Temkin Experience Ratings report.

P.S. Net Promoter Score, Net Promoter, and NPS are registered trademarks of Bain & Company, Satmetrix Systems, and Fred Reichheld.

Report: Economics of Net Promoter, 2015

1506_Economics of Net Promoter_COVERWe just published a Temkin Group report, Economics of Net Promoter, 2015. Here’s the executive summary:

Net Promoter® Score (NPS®) is a popular metric that companies use to analyze their customer experience efforts, but how does it actually relate to loyalty? We asked thousands of consumers to give an NPS to 293 companies across 20 industries, and then we examined the connection between NPS and four key areas of loyalty. We found that compared to detractors, promoters are more than five times as likely to repurchase from a company, more than five times as likely to forgive a company if it makes a mistake, more than seven times as likely to try a new offering shortly after its introduction, and that they recommend the company to about four times as many people. This analysis examines the loyalty behaviors of promoters, passives, and detractors across 20 industries: airlines, appliance makers, auto dealers, banks, rental car agencies, computer and tablet makers, credit card issuers, fast food chains, health plans, hotel chains, insurance carriers, Internet service providers, investment firms, parcel delivery services, retailers, software firms, supermarkets, TV service providers, utilities, and wireless carriers. The percentage of promoters who are likely to repurchase ranges from 96% for retailers, fast food chains, and supermarkets down to 77% for airlines, while the percentage of those who are likely to forgive ranges from 72% for computers & tablets, utilities, and supermarkets down to 51% for airlines. Meanwhile, the percentage of those who are likely to try new offerings ranges from 70% for major appliances and software firms down to 52% for banks. Ultimately, if a company wants to benefit from using NPS as a key metric, it must focus on improving customer experience, not obsessing over the metric itself.

Download report for $295
BuyDownload3

Here’s an excerpt from one of the 12 graphics, which shows the loyalty differences for promoters, passives, and detractors across all industries:

1506_ValueOfPromotersDetractors

The report provides loyalty data for promoters, passives, and detractors across 20 industries: airlines, auto dealers, banks, computer and tablet makers, credit card issuers, fast food chains, health plans, hotel chains, insurance carriers, Internet service providers, investment firms, major appliance makers, parcel delivery services, rental car agencies, retailers, software firms, supermarket chains, TV service providers, utilities, and wireless carriers.

Download report for $295
BuyDownload3

See our VoC/NPS resource page, which includes great resources for creating a successful NPS program. You mat also want to see our latest NPS Benchmark Report with NPS data on 283 companies.

The bottom line: Promoters are much more valuable than detractors.

Net Promoter Score, Net Promoter, and NPS are registered trademarks of Bain & Company, Satmetrix Systems, and Fred Reichheld.

Data Snapshot: Customer Experience Expectations and Plans for 2015

1503_DS_CXPlansFor2015_COVERWe just published a Temkin Group data snapshot, Customer Experience Expectations and Plans for 2015. This is our annual analysis of CX priorities and spending within large organizations (see last year’s data snapshot).

Here’s the data snapshot description:

In the first quarter of 2015, Temkin Group surveyed 207 respondents, each from a company with $500 million or more in annual revenues, about their customer experience efforts over the past year and their plans for 2015 and beyond. We compared the results of this survey to the results of similar surveys that we completed in Q4 of 2010, Q4 of 2011, Q4 of 2012, and Q4 of 2013. This year’s results show that companies are planning on dedicating more money and effort to improving a variety of customer experience activities in 2015.

Download report for $195
BuyDownload3

Here are some highlights from the data snapshot that contains 13 data-rich charts:

  • 42% of respondents think their CX efforts had a moderately or significantly positive impact on the business in 2014 and 78% expect to have a positive impact in 2015.
  • 82% of respondents think that CX will be more important to their organization this year than it was last year.
  • 66% of respondents expect that their company will spend more on CX this year than it did last year.
  • 40% of respondents have more than five people in their centralized CX team and 42% expect those numbers to rise (none are expecting a decline).
  • 31% of respondents expect to spend more on voice of the customer software vendors in 2015 than they did in 2014 and only 2% expect to spend less.
  • 88% of respondents expect to put more focus on Web experiences in 2015, a jump from 79% that expected to do the same last year. Social media and phone self-service interactions were the only areas that did not gain momentum.
  • 81% of respondents expect to put more focus on customer insights and analytics. The largest jump from last year is employee communications and engagement.
  • Building a customer-centric culture and predictive analytics are the areas that jumped the most this year when respondents identified the things that would have a significant impact on their organization’s CX in three years.

Download report for $195
BuyDownload3

The bottom line: Companies will be spending more time and money on CX this year

Report: What Happens After a Good or Bad Experience, 2015

1502_WhatHappensAfterGoodBadExper_COVERWe just published a Temkin Group report, What Happens After a Good or Bad Experience, 2015. This is our annual analysis of which companies deliver the most and least bad experiences, how consumers respond after those experience (in terms of sharing those experiences and changing their purchase behaviors), and the effect of service recovery (see last year’s report).

Here’s the executive summary:

To understand the effect of good and bad experiences, we asked 10,000 U.S. consumers about their recent interactions with 283 companies across 20 industries. Internet service providers and TV service providers deliver bad experiences more frequently than any other industries, as exemplified by Comcast and Charter Communications, each of which delivers a bad experience to about one in four customers, the most of any companies. Retailers, on the other hand, are least likely to deliver a negative experience. Out of all the industries, customers are most likely to stop spending completely after a bad experience with a computer and tablet maker, and they are most likely to reduce spending after a bad experience with a fast food chain. The economics of service recovery are compelling. Compared with companies that deliver a very poor response after a bad experience, companies that deliver a very good response have 41% fewer consumers cutting back on their spending and 31% more increasing their spending. Led by investment firms and major appliance makers, all industries improved or maintained their service recovery performance from last year. After a very bad or very good experience, consumers are more likely to give feedback back directly to the company than they are to post on Facebook, Twitter, or third party rating sites. These social sites, however, are still an important channel for consumers under the age of 45. When it comes to sharing bad experiences on social media, customers of Advantage Rent A Car and Alabama Power Company are the most likely to post about it on Facebook, while customers of Ameren Missouri Company and Fujitsu are the most likely to post about it on Twitter. The companies most likely to receive negatively biased feedback from their customers are Consolidated Edison of NY and Southern California Edison.

Download report for $195
BuyDownload3

Here’s the first figure in the report:

1502_BadExperiences

Here are some highlights from the report:

  • Nineteen percent of consumers who have interacted with TV service providers and Internet service providers report having a bad experience during the previous six months, the highest levels of any industry. Comcast (25%) and Charter Communications (24%) have the highest levels of consumers reporting bad experiences. The next three companies on the list are Motel 6, Time Warner Cable, and 21st Century insurance (all at 23%).
  • At the other end of the spectrum, only 4% of consumers report having a bad experience with a retailer, and six retailers are at 1%: True Value, Costco, Bed Bath & Beyond, Ace Hardware, Gap, and Staples.
  • The research examines the impact of bad experiences on consumer spending. Fifty-seven percent of consumers who had a bad experience with a fast food chain have decreased their spending with those stores and 32% of consumers who have had a bad experience with a computer company have completely stopped spending with the company. When it comes to health plans and utilities, two industries where consumers have a hard time switching, only 22% of consumers lower their spending after a bad experience.
  • The research shows that companies can increase their revenues when they respond very effectively after a bad experience. The difference in spending between a consumer who experiences a very poor response by a company and one who experiences a very good response is dramatic; the better response leads to 41% fewer consumers decreasing their spending with the company and 31% more increasing their spending.
  • The highest percent of consumers say that investment firms (48%) and major appliance makers (45%) have delivered a good response after a bad experience, while less than 20% of consumers feel that way about TV service providers and Internet service providers.
  • While 32% of consumers told the company about a very bad experience, only 25% shared their very good experiences. The percentage of consumers who communicated after a good experience increased for every channel except telling friends via traditional channels, which stayed even this year.
  • Across all age groups, consumers are most likely to give feedback about bad experiences directly to companies. With good experiences, the same is true with consumers who are at least 45 years old.
  • We examined how many customers of each company had shared negative feedback (to any company) on Facebook over the previous six months. At the top of the list are Advantage Rent A Car, Alabama Power Company, Ameren Illinois Company, AirTram Airways, Audi dealers, Fujitsu, Ameren Missouri Company, and CellularOne.

Download report for $195
BuyDownload3

The bottom line: Bad experiences are a real problem, especially if you don’t recover well.

Report: ROI of Customer Experience, 2014

1409_RoIofCX_COVERWe just published a Temkin Group report, ROI of Customer Experience, 2014. The research shows the connection between customer experience, loyalty, and revenue growth for 19 industries. Here’s the executive summary:

To understand how customer experience corresponds to loyalty, we examined feedback from 10,000 U.S. consumers describing their experiences with and their loyalty to 268 companies. Our analysis shows a strong correlation between customer experience and loyalty factors such as repurchasing, trying new offerings, forgiving mistakes, and recommending the company to friends and colleagues. We compared the consumers who gave companies a very good customer experience rating to those who gave companies a very bad customer experience rating, and we found that the percentage of customers who plan on repurchasing products is 18 percentage-points higher at organizations with excellent CX ratings. Additionally, the Net Promoter Scores of companies with very good CX ratings average 22 points higher than the scores of companies with poor CX. We built a model to evaluate how customer experience impacts a $1 billion business’s revenue over three years in each of the 19 industries, and this model shows that CX has the largest impact on hotels ($461 million), fast food chains ($437 million), and retailers ($428 million). This report also includes a five-step approach for building a model that estimates the value of CX for your organization.

Download report for $395
BuyDownload3

The report has 29 charts, which includes specific details on the connection between customer experience, loyalty, and increased revenues for each of the 19 industries in the study: airlines, appliance makers, auto dealers, banks, car rental agencies, computer makers, credit card issuers, fast food chains, grocery chains, health plans, hotel chains, insurance carriers, Internet service providers, investment firms, parcel delivery services, retailers, software firms, TV service providers, and wireless carriers.

Here’s the first figure in the report:

CXLoyaltyCorrelation

Download report for $395
BuyDownload3

The bottom line: Customer experience is highly correlated with loyalty.

Report: The Economics of Net Promoter

EconomicsOfNPS_COVER

We just published a Temkin Group report, The Economics of Net Promoter, which examines the link between NPS and loyalty across 19 industries. Here’s the executive summary:

Net Promoter Score (NPS) is a popular metric, but how does it relate to loyalty? We analyzed responses from thousands of consumers and examined the connection between NPS and three areas of loyalty: likelihood to repurchase, likelihood to forgive, and the actual number of times they recommend a company. Compared to detractors, promoters are almost six times as likely to forgive, are more than five times as likely to repurchase, and are more than twice as likely as detractors to actually recommend a company. Examining the data, we also found that consumers who gave a score between 0 and 4 have particularly low levels of loyalty. The analysis examines 19 industries: airlines, appliance makers, auto dealers, banks, car rental agencies, computer makers, credit card issuers, fast food chains, grocery chains, health plans, hotel chains, insurance carriers, Internet service providers, investment firms, parcel delivery services, retailers, software firms, TV service providers, and wireless carriers. Promoters who are likely to repurchase range from 87% for grocery chains to 73% for TV service providers, those who are likely to forgive range from 72% for rental car agencies to 59% for TV service providers, and those who actually recommended a company range from 80% for retailers to 47% for parcel delivery services.

Download report for $295 (includes Excel dataset)
BuyDownload3

Here’s the first figure from the report. It has a total of 43 figures that include specific graphics for each of the 19 industries in the study.

NPSeconomics

Here’s an excerpt from the first section that examines the data across all industries:

To understand how NPS relates to customer loyalty, we examined NPS scores for companies across 19 industries based on feedback from 10,000 U.S. consumers. The analysis covers more than 95,000 pieces of feedback from consumers about those companies. Examining three areas of loyalty across industries, looking at promoters versus detractors, we found that:

  • Promoters are almost six times as likely to forgive. We asked consumers about their likelihood to forgive a company if it delivered a bad experience and found that 64% of promoters are likely to forgive compared with 11% of detractors.
  • Promoters are more than five times as likely to repurchase. We asked consumers about their likelihood to make additional purchases from a company and found that 81% of promoters are likely to repurchase compared with 16% of detractors.
  • Promoters are more than twice as likely as detractors to actually recommend. In a separate study of 5,000 U.S. consumers, we asked consumers how many times they actually recommended each company. It turns out that 64% of promoters have recommended the company compared with 24% of detractors.

We also examined the level of loyalty across each response on the NPS scale between 0 and 10. This analysis shows that:

  • Super detractors are much less loyal. Forgiveness and repurchase loyalty stay at a consistent low level between 0 and 4 on the scale. Actual recommendations begin to increase after 5.
  • Midpoint attracts low recommenders. When we examine the actual quantity of recommendations across the NPS scale it turns out that there’s significant drop in recommendations at the midpoint of the scale, when 5 is selected.
  • Text anchors attract responses. We analyzed the volume of responses across the 11 point scale. Consumers appear to select the three responses with text anchors at a disproportionately high rate: “0,” “5,” and “10.”

Download report for $295 (includes Excel dataset)BuyDownload3The Excel file provides all of the data from the 43 figures. Note: See our report, Net Promoter Score Benchmark Study, 2012 and the post 9 Recommendations For Net Promoter Score along with all of my other resources for NPS programs.

The bottom line: Promoters are more loyal than detractors.

P.S. Net Promoter Score, Net Promoter, and NPS are registered trademarks of Bain & Company, Satmetrix Systems, and Fred Reichheld.

Report: The ROI of Customer Experience

We just published a new Temkin Group report, The ROI of Customer Experience. The report provides groundbreaking analysis of 10,000 US consumers and 3,000 UK consumers, identifying the financial benefit of improving customer experience. Here is the executive summary:

An analysis of US and UK consumers shows that customer experience is highly correlated to loyalty. Customer experience leaders have more than a 16 percentage point advantage over customer experience laggards in consumers’ willingness to buy more, their reluctance to switch business away, and their likelihood to recommend. A modest increase in customer experience can result in a gain over three years of up to $382 million for US companies and up to £263 million for UK firms, depending on the industry. While the case for loyalty is compelling, companies should determine the business impact that customer experience has on their specific business by following our five step process. To achieve these results, however, companies must create customer experience metrics programs that embed these measurments into how they run their business.

Download report for $195

I put together this infographic which captures some of the high-level findings from the report:

Download report for $195

The bottom line: Customer experience correlates to loyalty.