
We recently released the 2016 Temkin Experience Ratings that ranks the customer experience of 294 companies across 20 industries based on a survey of 10,000 U.S. consumers.
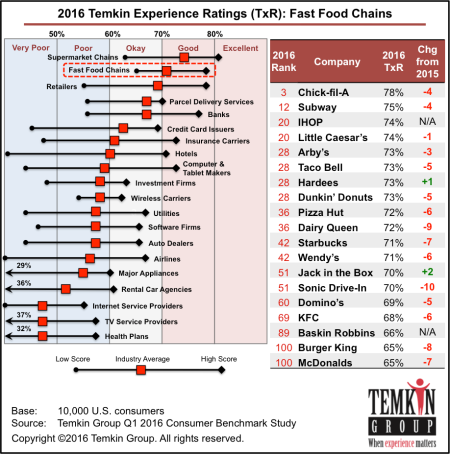
Chick-fil-A and Subway deliver the best customer experience in the fast food industry, according to the 2016 Temkin Experience Ratings, an annual ranking of companies based on a survey of 10,000 U.S. consumers.
Chick-fil-A took the top spot for the fifth year in a row with a rating of 78%, putting it in 3rd place out of 294 companies across 20 industries. Subway, meanwhile, came in second with a rating of 75% and an overall ranking of 12th.
At the other end of the spectrum, McDonalds and Burger King tied as the lowest scoring fast food restaurants. Each received a rating of 65%, putting them in 100th place. Only three other fast food chains failed to earn at least a “good” rating: Baskin Robbins, KFC, and Domino’s.
Overall, the fast food industry averaged a 71% rating in the 2016 Temkin Experience Ratings and placed 2nd out of 20 industries. The average rating of the industry decreased by five percentage-points between 2015 and 2016, dropping from 76% to 71%.
Here are some additional findings from the fast food industry: Read more of this post
Filed under 2016 Temkin Ratings, Customer experience
Tagged with Arby's, Baskin Robbins, Burger King, Chick-fil-A, Dairy Queen, Domino's, Dunkin' Donuts, Hardees, IHOP, Jack in the Box, KFC, Little Caesar's, McDonalds, Pizza Hut, Sonic Drive-In, Starbucks, Subway, Taco Bell, Wendy's
 We just published a Temkin Group report, What Happens After a Good or Bad Experience, 2014. The report, which includes 19 data charts, examines which companies and industries provide the most bad experiences, what impact those experiences have on spending, and how the negative impacts of bad experiences can be mitigated by good service recovery. The report also examines how consumers share their good and bad experiences with companies as well as with other people. Here’s the executive summary:
To understand the effect of good and bad experiences, we asked 10,000 U.S. consumers about their recent interactions with 268 companies across 19 industries. Results show that Internet services and TV services are the industries most likely to deliver a bad experience to their customers, while grocery chains are the least likely to. At the company level, Scottrade had the smallest percentage of customers reporting a recent bad experience with the company and Time Warner Cable had the highest. More than half of the customers who encountered a bad experience at a fast food chain, credit card issuer, grocery store, or hotel either decreased their spending with the company or stopped altogether. However, our data shows that a good service recovery effort can help mitigate a bad experience. Unfortunately, many firms—especially in the banking, Internet services, and TV services sectors—aren’t very good at service recovery. In addition to the consequences of bad interactions, we also examined which channels customers use to share their good and bad experiences and how these changed across age groups. We then compared these results to survey responses from the past two years. We also uncovered a negative bias inherent in how customers provide feedback. ING Direct, Residence Inn, and Fairfield Inn have the most negative bias in the feedback they receive directly from customers, while Hy-Vee and Hyundai have the most negative bias on Facebook.
Click link to see full list of industries and companies covered in this report (.pdf).
Download report for $195

One of the most interesting analyses in the report is the look at how service recovery after a bad experience affects the spending pattern of consumers. Here’s a summary of one of the charts showing just how important it is for a company to recover well after making a mistake:

Here are some other insights from the research:
- Sixteen percent of consumers who have interacted with TV service and Internet service providers report having a bad experience over the previous six months. Next on the list are wireless carriers, with 12% of their customers reporting a bad experience. At the other end of the spectrum, only 3% of consumers report a bad experience with grocery chains and 4% report having a bad experience with fast food chains.
- The five companies with the most customers reporting bad experiences are Time Warner Cable (25%), Motel 6 (22%), Coventry Health Care (21%), and Comcast (21%). There were 10 companies with only 1% or less of their customers reporting bad experiences: Scottrade, Chick-fil-A, H.E.B., Whole Foods, ShopRite, ING Direct, Starbucks, Trader Joe’s, Vanguard, and True Value.
- More than one-quarter of consumers who have a bad experience stop spending with computer makers, car rental agencies, credit card issuers, hotel chains, and software companies. The impact of bad experiences is less costly for parcel delivery services, wireless carriers, health plans, TV service providers, Internet service providers, and grocery chains, as less than 15% of their customers with bad experience stopped spending.
- The industries that are the best at responding to a bad experience are investment firms, major appliances, retailers, and car rental agencies. The industries that are the worst at responding to a bad experience are TV service providers, wireless carriers, Internet service providers, parcel delivery services, and health plans.
- Thirty-two percent of consumers give feedback directly to companies after a very bad experience and 23% give feedback after a very good experience.
- Overall, 25- to 34-year-olds are the most likely to share feedback about their experiences. After a good experience 57% tell a friend directly, 28% share on Facebook, and 18% put a comment or rating on a review site. After a bad experience, 60% tell a friend directly, 31% share on Facebook, and 20% write a review.
Download report for $195
The bottom line: Make sure to recover quickly after a bad experience
Filed under Benchmarks, Bruce Temkin Research, Customer Connectedness, Customer experience, Temkin Group Research, Trends
Tagged with 21st Century, 7-Eleven, A&P, AAA, Ace Hardware, Acer, Activision, Adobe, Advance Auto Parts, Aetna, AIG, AirTran Airways, ALamo, Alaska Airlines, Albertsons, Aldi, Allstate, Amazon.com, American Airlines, American Express, American Family, Ameriprise Financial, Anthem, AOL, Apple, Arby's, AT&T, Audi, AutoZone, Avis, Bank Of America, Barclaycard, Barnes & Noble, Baskin Robbins, Bed Bath & Beyond, Best Buy, Best Western, BJs Wholesale Club, Blackboard, Blue Shield of California, BMW, Bosch, Bright House, Budget, Buick, Burger King, Cablevision, Cadillac, Capital One, CareFirst, Charles Schwab, Charter Communications, Chase, Chevrolet, Chick-fil-A, Chrysler, Cigna, Citibank, Citigroup, Citizens, Comcast, Comfort Inn, Compaq, Costco, Courtyard By Marriott, Coventry Health Care, Cox Communications, credit unions, Crowne Plaza, CVS, Dairy Queen, Days Inn, Dell, Delta, DHL, DirecTV, Discover, Dish Network, Dodge, Dollar, Dollar General, Dollar Tree, Domino's, Dunkin' Donuts, E*Trade, eBay, Edward Jones, Electrolux, eMachines, Empire, Enterprise, Fairfield Inn, Family Dollar, Farmers, FedEx, Fidelity Investments, Fifth Third, Food Lion, Foot Locker, Ford, Fujitsu, GameStop, Gap, Gateway, GE, Geico, Giant Eagle, GM, Google, H.E.B, Haier, Hampton Inn, Hardees, Health Net, Hertz, Hewlett-Packard, Highmark, Hilton, Hitachi, Holiday Inn, Holiday Inn Express, Home Depot, Honda, HSBC, Humana, Hy-Vee, Hyatt, Hyundai, ING Direct, Intuit, Jack in the Box, JCPenney, Jeep, JetBlue Airlines, Kaiser Permanente, KFC, Kia, Kmart, Kohl's, Kroger, La Quinta Inn, Lenovo, Lexus, LG, Liberty Mutual, Little Caesar's, Lowe's, Macy's, Marriott, Marshalls, Mazda, McAfee, McDonalds, Medicaid, Medicare, Mercedes Benz, Merrill Lynch, MetLife, MetroPCS, Microsoft, Morgan Stanley Smith Barney, Motel 6, MSN, National, Nationwide, New York Life, Nissan, Nordstrom, O'Reilly Auto Parts, Office Depot, OfficeMax, Old Navy, Optimum (iO)/Cablevision, Orange Julius, PetSmart, Piggly Wiggly, Pizza Hut, PNC, Progressive, Publix, Quality Inn, Quiznos, QVC, Qwest, RadioShack, Regions, Residence Inn, Rite Aid, Ross, Safeway, Sam's Club, Samsung, Save-a-Lot, Scottrade, Sears, Sheraton, ShopRIte, Sonic Drive-In, Sony, Southwest Airlines, Sprint, Staples, Starbucks, State Farm, Stop & Shop, Subway, SunTrust Bank, Super 8, Symantec, T-Mobile, T.J. Maxx, Taco Bell, Target, TD Ameritrade, TD Bank, The Hartford, Time Warner Cable, Toshiba, Toyota, Toys "R" Us, TracFone, Trader Joe's, Travelers, TriCare, True Value, U.S. Bank, United Airlines, United Healthcare, UPS, US Airways, US Cellular, US Postal Service, USAA, Vanguard, Verizon, Verizon Wireless, Virgin Mobile, Volkswagen, Wal-Mart, Walgreens, Wells Fargo, Wendy's, Westin, Whirlpool, Whole Foods, Winn-Dixie
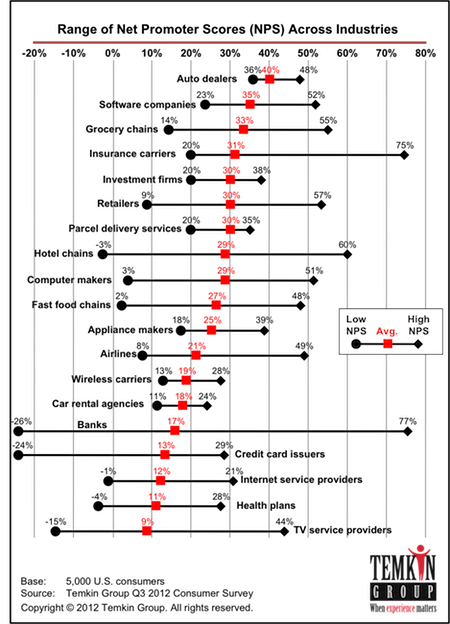
 We just published a Temkin Group report, Net Promoter Score Benchmark Study, 2012. It provides NPS data on 175 U.S. companies across 19 industries. Here’s the executive summary:
USAA took the top two spots for its banking and insurance businesses while HSBC came in at the bottom for banking and credit cards. Our analysis of differences across consumer demographic segments showed that NPS tends to go up with age, doesn’t vary much by income levels, and is often highest with Asians. We also asked consumers what would make them more likely to recommend the companies and found that promoters are more likely to select lower prices and detractors are more likely to select better customer service. While there is some debate about the efficacy of NPS, our analysis shows that promoters are much more likely than detractors to purchase more in the future across all industries. To help you implement a successful NPS program, we’ve included eight tips such as don’t believe in an “ultimate question” and use control charts, not pinpointed goals. The industries included in this report are airlines, auto dealers, banks, computer makers, credit card issuers, fast food chains, grocery chains, health plans, hotel chains, insurance carriers, Internet service providers, investment firms, major appliance makers, parcel delivery services, rental car agencies, retailers, software firms, TV service providers, and wireless carriers.
Download report for $295
(includes the data)
The industries included in this report are airlines, auto dealers, banks, computer makers, credit card issuers, fast food chains, grocery chains, health plans, hotel chains, insurance carriers, Internet service providers, investment firms, major appliance makers, parcel delivery services, rental car agencies, retailers, software firms, TV service providers, and wireless carriers.
The report contains the following components:
- NPS for 175 companies across 19 industries
- NPS differences based on age, income, and ethnicity of consumers
- Improvement areas selected by promoters and detractors by industry
- Connection between NPS and future purchases by industry
- Eight tips for implementing a successful NPS program

Download report for $295
(Includes the data)
The bottom line: Companies need to give customers a reason to recommend them
Filed under Benchmarks, Customer Connectedness, Customer experience, Net Promoter, Temkin Group Research, Voice of the customer
Tagged with A credit union, AAA, Acer, Adobe, Aetna, Albertsons, Aldi, Allstate, Amazon.com, American Airlines, American Express, American Family, Anthem (BCBS), AOL, Apple, Arby's, AT&T, Bank Of America, Barnes & Noble, Baskin Robbins, Best Buy, Best Western, BJs Wholesale Club, Blue Shield of California, BMW, Bright House, Budget, Burger King, Cablevision, Cadillac, Capital One, Charles Schwab, Charter Communications, Chase, Chevrolet, Chick-fil-A, Cigna, Citibank, Citigroup, Citizens, Comcast, Comfort Inn, Compaq, Costco, Courtyard By Marriott, Cox Communications, CVS, Dairy Queen, Days Inn, Dell, Delta/Northwest Airlines, DHL, DirecTV, Discover, DISH Network/EchoStar, Dollar, Domino's, Dunkin' Donuts, E*Trade, eBay, Enterprise, Farmers, FedEx, Fidelity Investments, Fifth Third, Food Lion, Ford, Gap, Gateway, GE, Geico, Giant Eagle, Google, H.E.B, Hampton Inn, Hardees, Hertz, Hewlett-Packard, Hilton, Holiday Inn, Holiday Inn Express, Home Depot, Honda, HSBC, Humana, ING Direct, Jack in the Box, JCPenney, JetBlue Airlines, Kaiser Permanente, KFC, Kmart, Kohl's, Kroger, LG, Little Caesar's, Lowe's, Macy's, Marriott, McAfee, McDonalds, Medicaid, Medicare, Merrill Lynch, Microsoft, Motel 6, Nationwide, Nissan, Office Depot, OfficeMax, Old Navy, Pizza Hut, PNC, Progressive, Publix, Quiznos, QVC, Qwest, RadioShack, Regions, Rite Aid, Road Runner, Safeway, Sam's Club, Samsung, Save-a-Lot, Sears, ShopRIte, Sonic Drive-In, Southwest Airlines, Sprint, Staples, Starbucks, State Farm, Stop & Shop, Subway, SunTrust Bank, T-Mobile, Taco Bell, Target, TD Bank, Time Warner Cable, Toshiba, Toyota, Toys "R" Us, TracFone, TriCare, United Airlines, United Healthcare, UPS, US Bancorp, US Postal Service, USAA, Verizon, Verizon Wireless, Virgin Mobile, Wal-Mart, Walgreens, Wells Fargo, Wells Fargo Advisors, Wendy's, Whirlpool, Whole Foods, Winn-Dixie


