Report: The State of CX Metrics, 2016

1612_stateofcxmetrics2016_coverWe published a Temkin Group report, The State of CX Metrics, 2016. This is the sixth year of this study that examines the CX metrics efforts within large companies. Here’s the executive summary:

Temkin Group surveyed 183 companies to learn about how they use customer experience (CX) metrics and then compared their answers with similar studies we’ve conducted every year since 2011. We found that the most commonly used metrics continue to be likelihood-to-recommend and satisfaction, while the most successful metric is transactional interaction satisfaction. Only 10% of companies regularly consider the effect of CX metrics when they make day-to-day decisions. The top two problems companies face are limited visibility of CX metrics and the lack of taking action on metrics. Companies are best at measuring customer service and phone-based experiences and are worst at measuring the experiences of prospects and customers who defect. We also had companies complete Temkin Group’s CX Metrics Program Assessment, which examines four characteristics of a metrics program: consistent (does the company use common CX metrics across the organization?), impactful (do the CX metrics inform important decisions?), integrated (are trade-offs made between CX and financial metrics?), and continuous (do leaders regularly examine the CX metrics?). Only 11% of respondents received at least a “good” overall rating in this assessment, and companies earned the lowest average rating in integrated. Companies with stronger CX metrics programs deliver better customer experience and use more effort and likelihood-to-repurchase metrics.

See the State of CX Metrics studies from 2011, 201220132014, and 2015.

Download report for $195
BuyDownload3

Here are the results form our CX Metrics Competency & Maturity Assessment (one of 22 graphics in the report):

1612_cxmetricsmaturity

Download report for $195
BuyDownload3

Report: ROI of Customer Experience, 2016

1610_roiofcx_coverWe published a Temkin Group report, ROI of Customer Experience, 2016. This research shows that CX is highly correlated to loyalty across 20 industries. Here’s the executive summary:

To understand the connection between customer experience (CX) and loyalty, we examined feedback from 10,000 U.S. consumers that describes both their experiences with and their loyalty to different companies. To examine the CX component, we used the 2016 Temkin Experience Ratings (TxR), which evaluated 294 companies. Our analysis shows that there’s a very large correlation between companies’ TxR and the willingness of customers to purchase more from them. This connection holds true for other areas of customer loyalty as well. We used this data to calculate the revenue impact of CX across 20 industries. We found that a moderate increase in CX generates an average revenue increase of $823 million over three years for a company with $1 billion in annual revenues. Rental car agencies have the most to gain from improving CX ($967 million), while utilities have the least to gain ($645 million). While all three components of customer experience¬—success, effort, and emotion—have a strong effect on loyalty, our research shows that emotion is the most important element. When compared with companies with very poor CX, companies with very good CX have a 16.7 percentage-point advantage in customers who are willing to purchase more from them, 16.7 percentage-point advantage in customers who trust them, 10.3 percentage-point advantage in customers willing to forgive them if they make a mistake, and 7.1 percentage-point advantage in customers who are willing to try their new products. Additionally, companies with very good CX ratings have an average Net Promoter Score that is 22 points higher than the scores of companies with poor CX. We recommend that you build your own CX ROI models, using our five-step approach for guidance.

Download report for $295
BuyDownload3

This is one of the figures in the report, and it shows the high correlation between Temkin Experience Ratings (customer experience) and purchase intentions for 294 companies across 20 industries:
1610_purchasemorecorrelationgraphHere’s an excerpt from the graphic showing the three year impact on revenues for a $1 billion company in 20 different industries:

1610_roirevsbyindustry

Download report for $295
BuyDownload3

To see the customer experience levels of all 294 companies, download to the free 2016 Temkin Experience Ratings report.

P.S. Net Promoter Score, Net Promoter, and NPS are registered trademarks of Bain & Company, Satmetrix Systems, and Fred Reichheld.

Report: State of Voice of the Customer Programs, 2016

1610_stateofvocprograms2016_coverWe published a Temkin Group report, State of Voice of the Customer Programs, 2016. This is the sixth year that we’ve benchmarked the competency & maturity of voice of the customer programs within large organization. Here’s the executive summary:

For the sixth straight year, Temkin Group has benchmarked the competency and maturity levels of voice of the customer (VoC) programs within large organizations. We found that while most companies think that their VoC efforts are successful, less than one-third of companies actually consider themselves good at reviewing implications that cut across the organization. Respondents think that in the future, the most important source of insights will be customer interaction history and the least important source will be multiple-choice questions. And although respondents believe that technology will play an increasingly important role in their VoC efforts, they also cite “integration across systems” as the biggest obstacle to their VoC success, and this concern has only grown in the past year. In addition to asking questions about their VoC program, we also had respondents complete Temkin Group’s VoC Competency and Maturity Assessment, which examines capabilities across what we call the “Six Ds”: Detect, Disseminate, Diagnose, Discuss, Design, and Deploy. Only 16% of companies have reached the two highest levels of VoC maturity, while 43% remain in the bottom two levels. When we compared higher-scoring VoC programs with lower-scoring programs, we found that companies with mature programs are more successful, they focus more on analytics, and they have more full-time staff, more strongly coordinated efforts, and more involved senior executives.

See the State of VoC reports from 2010201120132014, and 2015.

Download report for $195
BuyDownload3

Here are the results from Temkin Group’s VoC Competency & Maturity Assessment:

1610_vocmaturity

Download report for $195
BuyDownload3

Report: Net Promoter Score Benchmark Study, 2016

1610_npsbenchmarkstudy_coverWe published a Temkin Group report, Net Promoter Score Benchmark Study, 2016. This is the fifth year of this study that includes Net Promoter® Scores (NPS®) on 315 companies across 20 industries based on a study of 10,000 U.S. consumers. Here’s the executive summary:

As many large companies use Net Promoter® Score (NPS) to evaluate their customer loyalty, Temkin Group measured the NPS of 315 companies across 20 industries. With an NPS of 68, USAA’s insurance business earned the highest score in the study for the fourth year in a row. Four other companies also earned an NPS of 60 or higher: Cadillac, USAA’s banking business, Apple, and USAA’s credit card business. In addition to earning some of the top scores, USAA’s banking, credit card, and insurance businesses also all outpaced their respective industries’ averages by more than any other company. Comcast, meanwhile, earned the lowest NPS for the second year in a row, coming in just below Time Warner Cable, Cox Communications, and McDonalds. And while all 20 industries increased their average NPS from last year, utilities enjoyed the biggest improvement in its score. Out of all the companies, US Airways’s and Advantage Rent-A-Car’s scores improved the most, whereas TriCare’s and Lexus’s scores declined the most. On average across the industries, the youngest consumers gave companies the lowest NPS, while 35- to 44-year-olds gave them the highest NPS.

See the NPS Benchmark Studies from 2012, 20132014, and 2015.

Here’s a list of companies included in this study (.pdf).

Download report for $495
(includes report (in .pdf) plus dataset in Excel)
BuyDownload3

Here are the NPS scores across 20 industries:
1610_rangeofindustrynps

Here are some other highlights of the research:

  • Five industries toped the list with an average NPS of 40 or more: auto dealers, software, investments, computers & tablets, and appliances.
  • The bottom scoring industries are TV service providers, Internet service providers, and health plans.
  • USAA’s insurance, banking, and credit card businesses earned NPS levels that are 30 or more points above their industry averages. Five other firms are 20 or more points above their peers: com, credit unions, Chick-fil-A, Apple, and Trader Joe’s.
  • Five companies fell 25 or more points below their industry averages: RadioShack, Motel 6, eMachines, McDonalds, and Days Inn.
  • US Airway’s NPS increased by 31 points between 2015 and 2016, the largest increase of any company. Eight other companies improved by 25 or more points: Fifth Third, 21st Century, Fujitsu, DHL, MetLife, HSBC, Commonwealth Edison, PSE&G, and Hannaford.
  • TriCare, Lexus, Mercedes-Benz, Baskin Robins, and Nordstrom had double-digit declines in NPS between 2015 and 2016.

Download report for $495
(includes report (in .pdf) plus dataset in Excel)
BuyDownload3

If you want to know what data is included in this report and dataset, download this sample Excel dataset file.Screen Shot 2014-10-17 at 4.05.17 PM

P.S. Net Promoter Score, Net Promoter, and NPS are registered trademarks of Bain & Company, Satmetrix Systems, and Fred Reichheld.

CX Metrics: Immature, But Improving (Infographic)

Here are some of insights from the report, State of CX Metrics, 2015.

2016TemkinGroupINFOGRAPHIC_CXMetrics

You can download (and print) this infographic in different forms:

Report: Benchmarking HR’s Support of CX and Employee Engagement

1602_HRinCXBenchmark_FCOVERWe published a Temkin Group report, Benchmarking HR’s Support of CX and Employee Engagement.  We surveyed 300 HR professionals from large organizations in North America and compared the results to a similar study we did in 2012. Here’s the executive summary:

Employee engagement is a critical component of customer experience (CX). To determine how effectively human resource (HR) departments support these engagement efforts, we surveyed 300 HR professionals from large companies and compared the results to a similar study we conducted in 2012. Seventy-three percent of HR professionals believe that it’s very important for their organization to become more customer-centric, but only 31% believe that HR professionals are significantly helping these efforts. The good news? That’s more than twice the level of HR support we found in 2012. Compared with 2012, companies are both measuring and acting on employee feedback more frequently, and HR professionals have more bandwidth to work on employee engagement. When we compared the companies that deliver outstanding customer experience with the companies that don’t, we found that the CX leaders have better financial performance, enjoy higher levels of engaged employees, are more customer- and mission-centric, have HR groups that are more actively involved in CX and employee engagement activities, and more frequently measure employee feedback. To improve employee engagement, companies must master the Five I’s of Employee Engagement: Inform, Inspire, Instruct, Involve and Incent.

Download report for $195
BuyDownload3

Here’s one of the 25 figures in the report:

1602_ImportanceOfCXCulture

Here are some other findings in the research: Read more of this post

Report: The State of CX Metrics, 2015

1512_StateOfCXMetrics2015_COVERWe published a Temkin Group report, The State of CX Metrics, 2015. This is the fifth year of this study that examines the CX metrics efforts within large companies. Here’s the executive summary:

Temkin Group surveyed nearly 200 large companies to learn about how they use customer experience (CX) metrics, and we then compared their answers with similar studies we’ve conducted every year since 2011. The most commonly used metrics continue to be likelihood-to-recommend and satisfaction, while the most successful metric is interaction satisfaction. And although the percentage of companies where senior leaders regularly refer to CX metrics has increased significantly from last year, fewer companies are making explicit trade-offs between CX metrics and financial metrics. Companies are best at measuring customer service and phone-based experiences and are worst at measuring the experiences of prospects and customers who defect. In addition to answering survey questions, we also had companies complete Temkin Group’s CX Metrics Competency and Maturity Assessment, which examines four areas of a metrics program: consistent (does the company use common CX metrics across the organization?), impactful (do the CX metrics inform important decisions?), integrated (are trade-offs made between CX and financial metrics?), and continuous (do leaders regularly examine the CX metrics?). Only 14% of respondents received at least a “good” overall rating, and companies earned the lowest rating in integrated. Ultimately, companies with stronger CX metrics programs deliver better customer experience, have stronger business results, more frequently measure ease of doing business, and compensate more employees based on CX metrics.

See the State of CX Metrics studies from 2011, 20122013, and 2014.

Download report for $195
BuyDownload3

Here are the results form our CX Metrics Competency & Maturity Assessment:

1512_CXMetricsAssessmentResults

Here are some other highlights of the research:

  • Forty-nine percent of companies with stronger CX metrics programs have well above average customer experience compared to 17% of those with weaker CX metrics programs. The stronger CX metrics programs are also 50% more likely to have significantly better business performance then their competitors.
  • While 64% of respondents rate their company as good or very good at collecting and sharing CX metrics, only 22% gave themselves those high marks when it came to making trade-offs between CX metrics and financial metrics.
  • Likelihood to recommend and satisfaction remain the most popular CX metrics, while companies are most successful in using satisfaction as a measure of specific customer interactions.
  • Seven out of 10 companies have compensation tied to CX metrics for some of their employees. Net Promoter® Score is the most common metric used and customer service is the most common group to have its compensation tied to CX metrics.
  • Companies are most effective at measuring customer service and phone interactions and least effective at measuring the experiences of prospects and customers who have defected.

Download report for $195
BuyDownload3

P.S. Net Promoter Score, Net Promoter, and NPS are registered trademarks of Bain & Company, Satmetrix Systems, and Fred Reichheld.

Report: 2015 Temkin Loyalty Index

1511_TemkinLoyaltyIndex_COVERWe published a Temkin Group report, 2015 Temkin Loyalty Index. This report ranks the loyalty of consumers to 293 companies across 20 industries. Here’s the executive summary:

The 2015 Temkin Loyalty Index evaluates the loyalty of 10,000 U.S. consumers to 293 companies across 20 industries. The Index is based on evaluating consumers’ likelihood to do five things: repurchase from the company, recommend the company to others, forgive the company if it makes a mistake, trust the company, and try the company’s new offerings. Our research shows that USAA, H-E-B, Publix, and Trader Joe’s are at the top of the list when it comes to consumer loyalty, while Con Edison of NY, Coventry Health Care, Comcast, and Time Warner Cable are at the bottom. At an industry level, supermarkets, fast food chains, and retailers inspire the highest loyalty levels. At the other end of the spectrum, TV service providers and Internet service providers have the lowest levels of loyalty. USAA, JetBlue Airways, TriCare, credit unions, ACE Rent A Car, Apple, and Georgia Power have loyalty levels that most outperform their industry averages. Conversely, Con Edison of NY, RadioShack, Blackboard, Coventry Health Care, Citibank, Jeep, Bi-Lo, and McDonalds fall farthest behind their peers.

Download report for $395
(includes report plus dataset in Excel)
BuyDownload3

Here are the leaders and laggards as well as the industry scores:

1511_TLi_TopBottom

1511_TLi_IndustryRanges

Here are some other highlights of the research:

  • The Temkin Loyalty Index is an average rating across consumers’ likelihood to do five things:
    • Repurchase from the company
    • Recommend the company to others
    • Forgive the company if it makes a mistake
    • Trust the company
    • Try the company’s new offerings
  • At an industry level, supermarkets, fast food chains, and retailers have the highest loyalty levels. At the other end of the spectrum, TV service providers and Internet service providers have the lowest.
  • USAA (for credit cards, banking, and insurance), JetBlue Airways, TriCare, credit unions, ACE Rent A Car, Apple, and Georgia Power have loyalty levels that most outperform their industry averages.
  • Con Edison of NY, RadioShack, Blackboard, Coventry Health Care, Citibank, Jeep, Bi-Lo, and McDonalds fall farthest behind their peers.
  • The average likelihood to purchase across all industries is the highest (67%) while the average likelihood to try new offerings is the lowest (42%).
  • H-E-B and USAA lead, and Con Edison of NY lags in repurchase.
  • Aldi and Hy-Vee lead, and Coventry Health Care lags in recommendations.
  • USAA and ACE Rent A Car lead, and Con Edison of NY lags in forgiveness.
  • ACE Rent A Car leads, and Citibank and Citizens lag in new product loyalty.
  • Credit unions and H-E-B lead, and Comcast lags in trust.

Download report for $395
(includes report plus dataset in Excel)
BuyDownload3

If you want to know what data is included in this report and dataset, download this sample Excel dataset file.

Report: State of Voice of the Customer Programs, 2015

1510_StateOfVoCPrograms2015_CoverWe published a Temkin Group report, State of Voice of the Customer Programs, 2015. This is the fifth year that we’ve benchmarked the competency & maturity of voice of the customer programs within large organization. Here’s the executive summary:

For the fifth year, Temkin Group has benchmarked the voice of the customer (VoC) programs within large organizations. We found that while most organizations consider their VoC efforts to be successful, less than one-third of organizations actually believe they are good at making changes to the business based on these insights. Respondents think that the most important source of insights in the future will be customer interaction history, and they think that going forward, multiple-choice questions will be the least important. Respondents believe that technology will play an increasingly important role in their efforts, but the largest obstacle to VoC success remains integration across systems. In addition to asking questions about their VoC program, we also had respondents complete Temkin Group’s VoC Competency and Maturity Assessment, which examines capabilities across what we call the “Six Ds”: Detect, Disseminate, Diagnose, Discuss, Design, and Deploy. Although only 16% of companies have reached the two highest levels of VoC maturity, this is still an improvement from the 11% last year. When we compared high-scoring VoC programs with lower-scoring programs, we found that companies with mature programs are more successful, focus more on analytics, have more full-time staff, have more strongly coordinated efforts, and have more involved senior executives.

See the State of VoC reports from 201020112013, and 2014.

Download report for $195
BuyDownload3

Here are the results from Temkin Group’s VoC Competency & Maturity Assessment:

1510_VoCCompetencyMaturity

Download report for $195
BuyDownload3

Report: ROI of Customer Experience, 2015

1510_RoIofCX_COVERWe published a Temkin Group report, ROI of Customer Experience, 2015. This research shows that CX is highly correlated to loyalty across 20 industries. Here’s the executive summary:

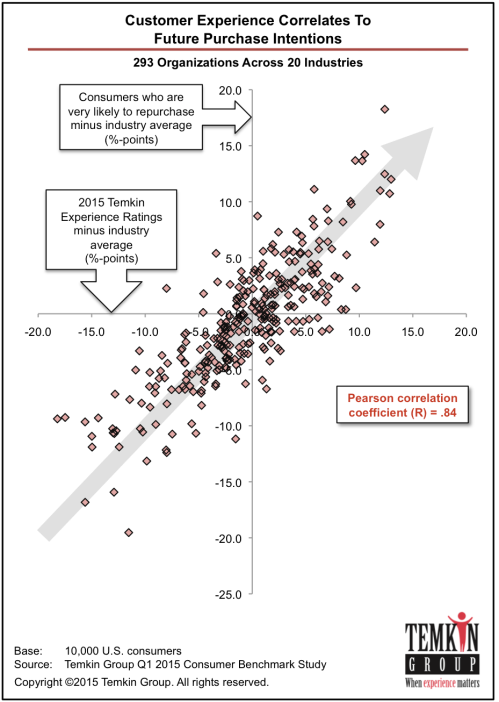
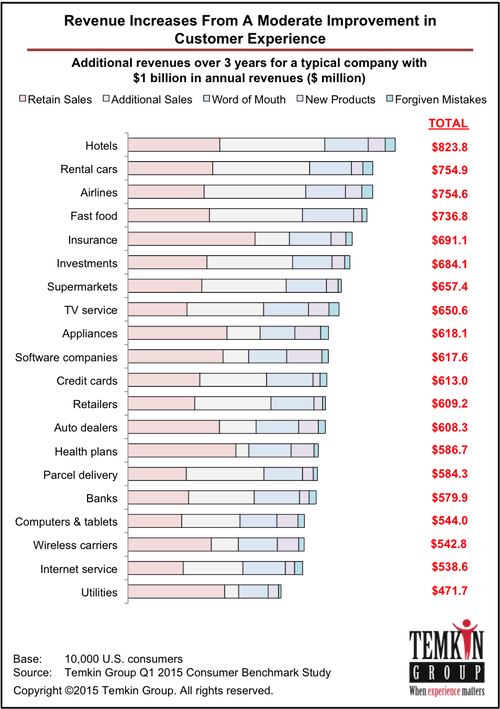
To understand the connection between customer experience (CX) and loyalty, we examined feedback from 10,000 U.S. consumers that describes both their experiences with and their loyalty to 293 companies across 20 industries. Our analysis shows a strong correlation between customer experience and loyalty factors such as repurchasing, trying new offerings, forgiving mistakes, and recommending the company to friends and colleagues. While all three components of customer experience—success, effort, and emotion—have a strong effect on loyalty, our research shows that emotion is the most important element. When we compared the consumers who gave companies a very good customer experience rating to those who gave companies a very bad customer experience rating, we found that at companies with high customer experience ratings, the percentage of customers who plan on purchasing more is 18 points higher, the percentage who will forgive the company if it makes a mistakes is 12 points higher, the percentage who will try a new offering is 10 points higher, and the percentage who trust the company is 19 points higher. Additionally, companies with very good CX ratings have an average Net Promoter® Score that is 24 points higher than the scores of companies with poor CX. We built a model to evaluate how, over a three-year period, customer experience impacts the revenue of a $1 billion business within each of the 20 industries. This model shows that CX has the largest impact on the revenue of hotels ($823 million) and rental cars ($755 million) over three years. This report also includes a five-step approach for building a model that estimates the value of CX for your organization.

Download report for $295
BuyDownload3

This is the first figure in the report, and it shows the high correlation between Temkin Experience Ratings (customer experience) and purchase intentions for 293 companies across 20 industries:
1510_CXvsRepurchase

Here’s an excerpt from the graphic showing the three year impact on revenues for a $1 billion company in 20 different industries:

1510_ROIRevenues

Download report for $295
BuyDownload3

To see the customer experience levels of all 293 companies, download to the free 2015 Temkin Experience Ratings report.

P.S. Net Promoter Score, Net Promoter, and NPS are registered trademarks of Bain & Company, Satmetrix Systems, and Fred Reichheld.

Report: Net Promoter Score Benchmark Study, 2015

1510_NPSBenchmarkStudy_COVERWe published a Temkin Group report, Net Promoter Score Benchmark Study, 2015. This is the fourth year of this study that includes Net Promoter® Scores (NPS®) on 291 companies across 20 industries based on a study of 10,000 U.S. consumers. Here’s the executive summary:

Many companies use Net Promoter® Score (NPS) to evaluate their customer loyalty, so we measured the NPS of 291 companies across 20 industries. The three companies with the highest scores are USAA, with an NPS of 70, and Lexus and Mercedes-Benz, each with an NPS of 62. Additionally, USAA’s banking, credit card, and insurance businesses all outpaced their respective industries’ averages by more than any other company. Meanwhile, at the bottom of the list, Comcast, Time Warner Cable, and McDonalds received the three lowest scores, and RadioShack, McDonalds, and eMachines fell the farthest below their respective industries’ averages. On an industry level, auto dealers earned the highest average NPS, while Internet service providers and TV service providers earned the lowest. Thirteen of the 20 industries increased their average NPS from last year, with banks enjoying the biggest jump in scores. Out of all the companies, HSBC’s and AirTran Airways’ scores improved the most, whereas Fujitsu’s and Highmark’s scores declined the most. For most industries, older consumers gave companies a higher NPS, while younger consumers gave companies a lower NPS. Investment firms have the largest generation gap.

See the NPS Benchmark Studies from 2012, 2013, and 2014.

Here’s a list of companies included in this study (.pdf).

Download report for $495
(includes report plus dataset in Excel)
BuyDownload3

Here are the NPS scores across 20 industries:
1510_NPS_IndustryRanges

Here are some other highlights of the research:

  • USAA’s insurance business earned the highest NPS (70), followed by Lexus (62) and Mercedes-Benz (62). Other firms to earn an NPS of 55 or more are H-E-B, USAA’s banking and credit card businesses, Apple’s computer business, Chick-fil-A, Wegmans, JetBlue Airways, and Amazon.
  • Comcast TV service (-17) earned the lowest NPS, followed by two firms that also had scores below -10: Time Warner Cable TV service and McDonalds. Other firms to earn NPS of -5 or below are Commonwealth Edison, Pacific Gas and Electric, Charter Communications (TV service and Internet service), Comcast Internet service, RadioShack, Time Warner Cable Internet service, Cablevision Optimum, and Coventry Health Care.
  • USAA’s insurance, banking, and credit card businesses earned NPS levels that are 38 or more points above their industry averages. Eight other firms more than 25 points above their peers: Chick-fil-A, TriCare, credit unions, JetBlue Airways, H-E-B, Wegmans, Amazon, and Apple.
  • Nine companies fell 30 or more points below their industry averages: RadioShack, McDonalds, eMachines, Travelers, Super 8, 7-Eleven, and Spirit Airlines.
  • HSBC’s NPS increased by 29 points between 2014 and 2015, the largest increase of any company. Nine other companies improved by more than 15 points: AirTran Airways, Baskin Robbins, Virgin America, Regions Bank, Citizens Bank, BMW, Southern California Gas, Morgan Stanley Smith Barney, and Food Lion.
  • Fujitsu, Highmark, Buick, and Humana had the largest decline in NPS between 2014 and 2015.

Download report for $495
(includes report plus dataset in Excel)
BuyDownload3

If you want to know what data is included in this report and dataset, download this sample Excel dataset file.Screen Shot 2014-10-17 at 4.05.17 PM

P.S. Net Promoter Score, Net Promoter, and NPS are registered trademarks of Bain & Company, Satmetrix Systems, and Fred Reichheld.

Report: Evaluating Mobile eGift Card Purchasing Experiences

1411- SLICE-B COVERWe published a Temkin Group report, Evaluating Mobile eGift Card Purchasing Experiences. The report uses Temkin Group’s SLICE-B experience review methodology to assess the mobile sites of 10 retailers. Here’s the executive summary:

Although smartphones are a convenient interaction channel, their small screens pose serious design challenges for companies. To evaluate the customer experience of mobile websites, we used Temkin Group’s SLICE-B experience review methodology to assess the experience of buying an eGift Card from ten large retailers: Home Depot, Lowe’s, Walmart, Target, Walgreens, CVS, Starbucks, Dunkin’ Donuts, Best Buy, and RadioShack. Home Depot earned the top score for its functionality and minimalist processes, while the user could not complete the full purchasing goal at Lowe’s, Walmart, Target, Walgreens, CVS, Best Buy, or RadioShack.

Download report for $195
BuyDownload3

The report includes the scores for all 10 companies across each of the six SLICE-B categories, strengths and weaknesses of each retailer, and some best practices across all of the mobile sites. Here is a description of the user and her overall goal that we tested:

Our user was a middle-aged woman looking to send her niece a $25 electronic gift card to help her get settled into her new apartment. While she is reasonably proficient at operating a smartphone, she finds entering a lot of information to be difficult on the small keyboard. She has an iPhone 4s. She does not have an app for any of the companies being evaluated and does not know whether they sell $25 eGift Cards.

Here are the overall results:

1411_GiftCardResults

Download report for $195
BuyDownload3

The bottom line: Gift cards should be easier to buy via mobile phones.

Report: Net Promoter Score Benchmark Study, 2014

1410_NPSBenchmarkStudy_COVERWe published a Temkin Group report, Net Promoter Score Benchmark Study, 2014. This is the third year of this study that includes Net Promoter® Scores (NPS®) on 283 companies across 20 industries based on a study of 10,000 U.S. consumers. Here’s the executive summary:

We measured the Net Promoter Score of 283 companies across 20 industries. USAA and JetBlue took the top two spots, each with an NPS of more than 60. USAA’s banking, credit card, and insurance businesses outpaced their industries’ averages by more than any other company. At the bottom of the list, HSBC and Citibank received the two lowest scores, and Super 8 and Motel 6 fell the farthest below their industry averages. On an industry level, auto dealers earned the highest average NPS, while TV service providers earned the lowest. Eleven of the 19 industries increased their average NPS from last year, with car rentals and credit cards enjoying the biggest score boosts. Out of all the companies, US Airways and Highmark BCBS improved the most, while Quality Inn and Baskin-Robbins declined the most. For most industries, the average NPS is highest with older consumers and is lowest with younger consumers. Investment firms have the largest generation gap.

Here’s a list of companies included in this study (.pdf).

Download report for $495
(includes report plus dataset in Excel)
BuyDownload3

Here are the NPS scores across 20 industries:

1410_industryNPS

Download report for $495
(includes report plus dataset in Excel)
BuyDownload3

If you want to know what data is included in this report and dataset, download this sample Excel dataset file.Screen Shot 2014-10-17 at 4.05.17 PM

P.S. Net Promoter Score, Net Promoter, and NPS are registered trademarks of Bain & Company, Satmetrix Systems, and Fred Reichheld.

Customer Effort, Net Promoter, And Thoughts About CX Metrics

There’s been a recent uptick in people asking me about Customer Effort Score (CES), so I thought I’d share my thoughts in this post.

As I’ve written in the past, no metric is the ultimate question (not even Net Promoter Score). So CES isn’t a panacea. Even the Temkin Experience Ratings isn’t the answer to your customer experience (CX) prayers.

The choice of a metric isn’t the cornerstone to great CX. Instead, how companies use this type of information is what separates CX leaders from their underperforming peers. In our report, the State of CX Metrics, we identify four characteristics that make CX metrics efforts successful:  Consistent, Impactful, Integrated, and Continuous. When we used these elements to evaluate 200 large companies, only 12% had strong CX metrics programs.

Should we use CES and how does it relate to NPS? I hear this type of question all the time. Let me start my answer by examining the four types of things that CX metrics measure: interactions, perceptions, attitudes, and behaviors.

1408_CXMetrics

CES is a perception measure while NPS is an attitudinal measure. In general, perception measurements are better for evaluating individual interactions. So CES might be better suited for a transactional survey while NPS may be better suited for a relationship survey. You can read a lot that I’ve written about NPS on our NPS resource page.

Now, on to CES. I like the concept, but not the execution. As part of our Temkin Experience Ratings, we examine all three aspects of experience—functional, accessible, and emotional. The accessible element examines how easy a company is to work with. I highly encourage companies to dedicate significant resources to becoming easier to work with and removing obstacles that make customers struggle.

But CES uses an oddly worded question: How much effort did you personally have to put forth to handle your request? (Note: In newer versions of the methodology, they have improved the language and scaling of the question). This version of the question goes against a couple of my criteria for good survey design:

  • It doesn’t sound human. Can you imagine a real person asking that question? One key to good survey design is that questions should sound natural.
  • It can be interpreted in multiple ways. If a customer tries to do something online, but can’t, did they put forth a lot of effort? How much effort does it take to move a mouse and push some keys?!? Another key to good survey design is to have questions that can only be interpreted in one way.

If you like the notion of CES (measuring how easy or hard something is to do), then I suggest that you ask a more straight forward question? How about: How easy did you find it to <FILL IN THING>? And let customers pick a response on a scale between “very easy” and “very difficult.”

My last thought is not about CES, but more about where the world of metrics is heading. In the future, organizations will collect data from interactions and correlate them with future behaviors (like loyalty), using predictive analytics to bypass all of these intermediary metrics. Don’t throw away all of your metrics today, but consider this direction in your long-term plans.

The bottom line: There is no such thing as a perfect metric.

The Satisfaction Quarterly Report, Q1 2008

I recently mentioned the American Customer Satisfaction Index (ACSI) to someone and was surprised that she had not heard of it. It’s a great research effort led by Claes Fornell at the University Of Michigan which tracks customer satisfaction on a quarterly basis. Here’s a chart of the national average since the index was created in 1994:

ACSI National Satisfaction Scores

As you can tell, satisfaction scores have been generally on the rise over the last few years.

The ACSI provides both company-specific and industry-specific data for a different set of industries every quarter. The Q1 2008 ACSI looked at the following industries: hotels, restaurants, hospitals, cable & satellite TV, cellular telephones, computer software, fixed line telephone service, motion pictures, network/cable TV news, newspapers, wireless telephone service, airlines, express delivery, U.S. Postal Service, and energy utilities.

Here are some of the highlights from that Q1 2008 data:

  • Best & Worst Organizations:
    • Top rated: FedEx Corporation (express delivery), UPS (express delivery), Olive Garden (restaurant), and Southern Company (Utility)
    • Largest improvement (since last year): Ameren Corporation (energy utilities), Reliant Energy (energy utilities), Energy Future Holdings (energy utilities), and McDonalds (limited service restaurants).
    • Lowest rated: US Airways (airlines), Charter Communications (cable & satellite TV), Comcast Corporation (cable & satellite TV), and Sprint Nextel (wireless telephone services).
    • Largest decline (since last year): US Airways (airlines), Continental Airlines (airlines), Sprint Nextel (wireless telephone services), and Northwest Airlines (airlines).
  • Best & Worst Industries:
    • Top rated: Express Delivery and Ambulatory Care.
    • Largest improvement (since last year): Hotels and Fixed Line Telephone Services.
    • Lowest rated: Airlines, Cable & Satelitte TV, and Newspapers. 
    • Largest decline (since last year): Newspapers and Broadcast TV News.

The bottom line: This should be a wake-up call to many firms (are you listening airlines and cable & satellite companies?).