Report: ROI of Customer Experience, 2016
October 24, 2016 Leave a comment
 We published a Temkin Group report, ROI of Customer Experience, 2016. This research shows that CX is highly correlated to loyalty across 20 industries. Here’s the executive summary:
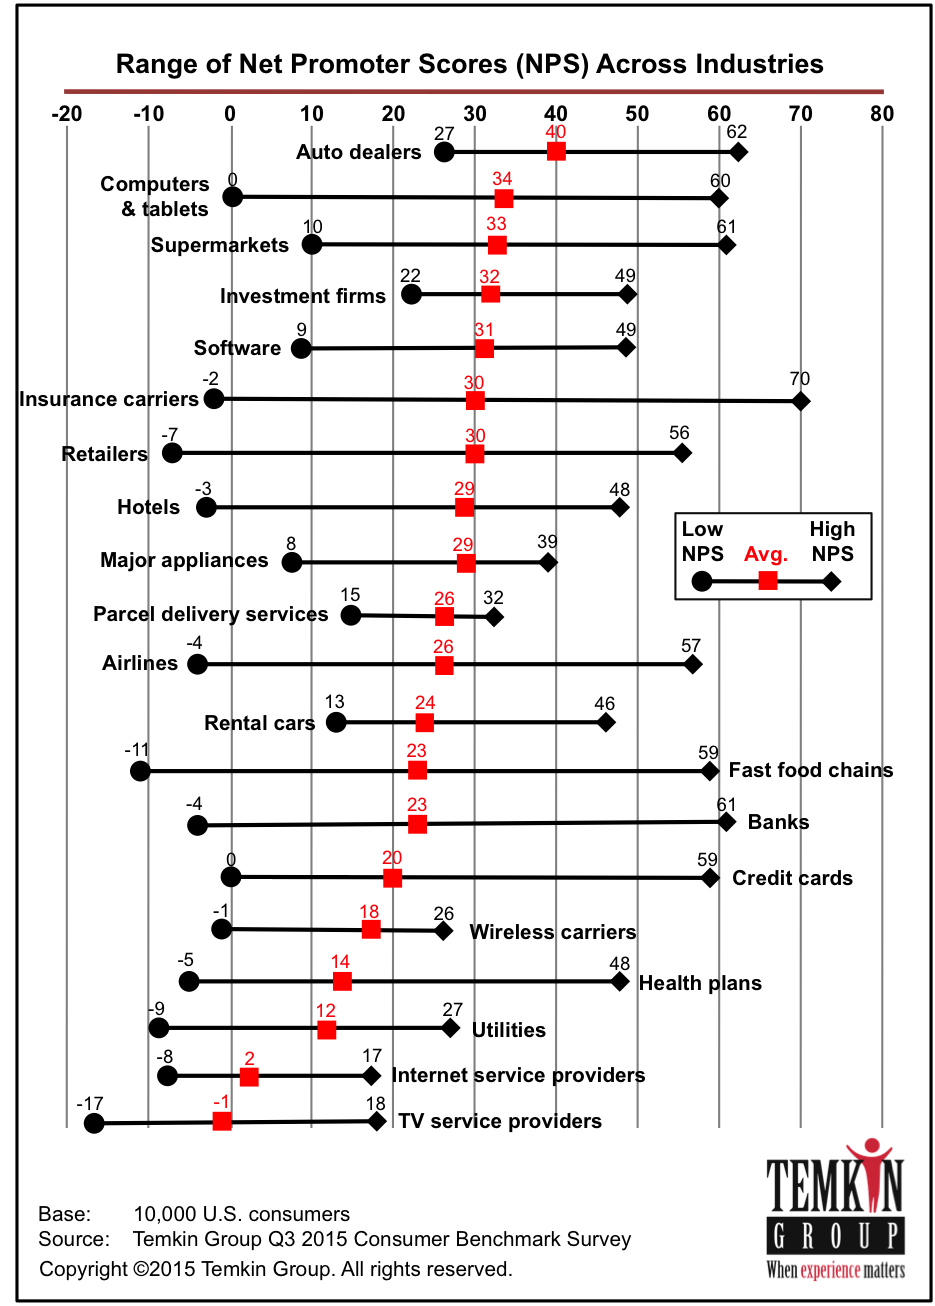
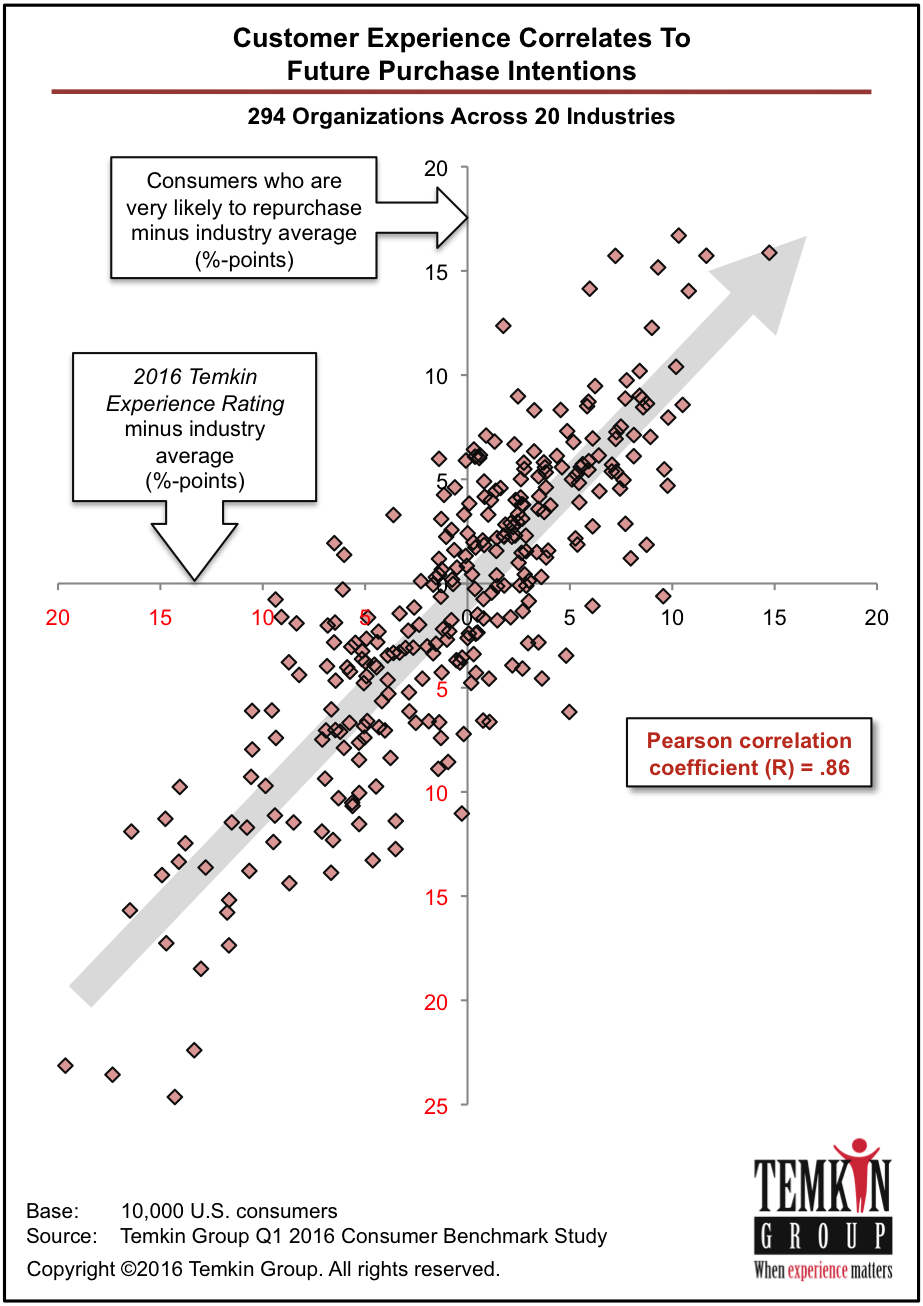
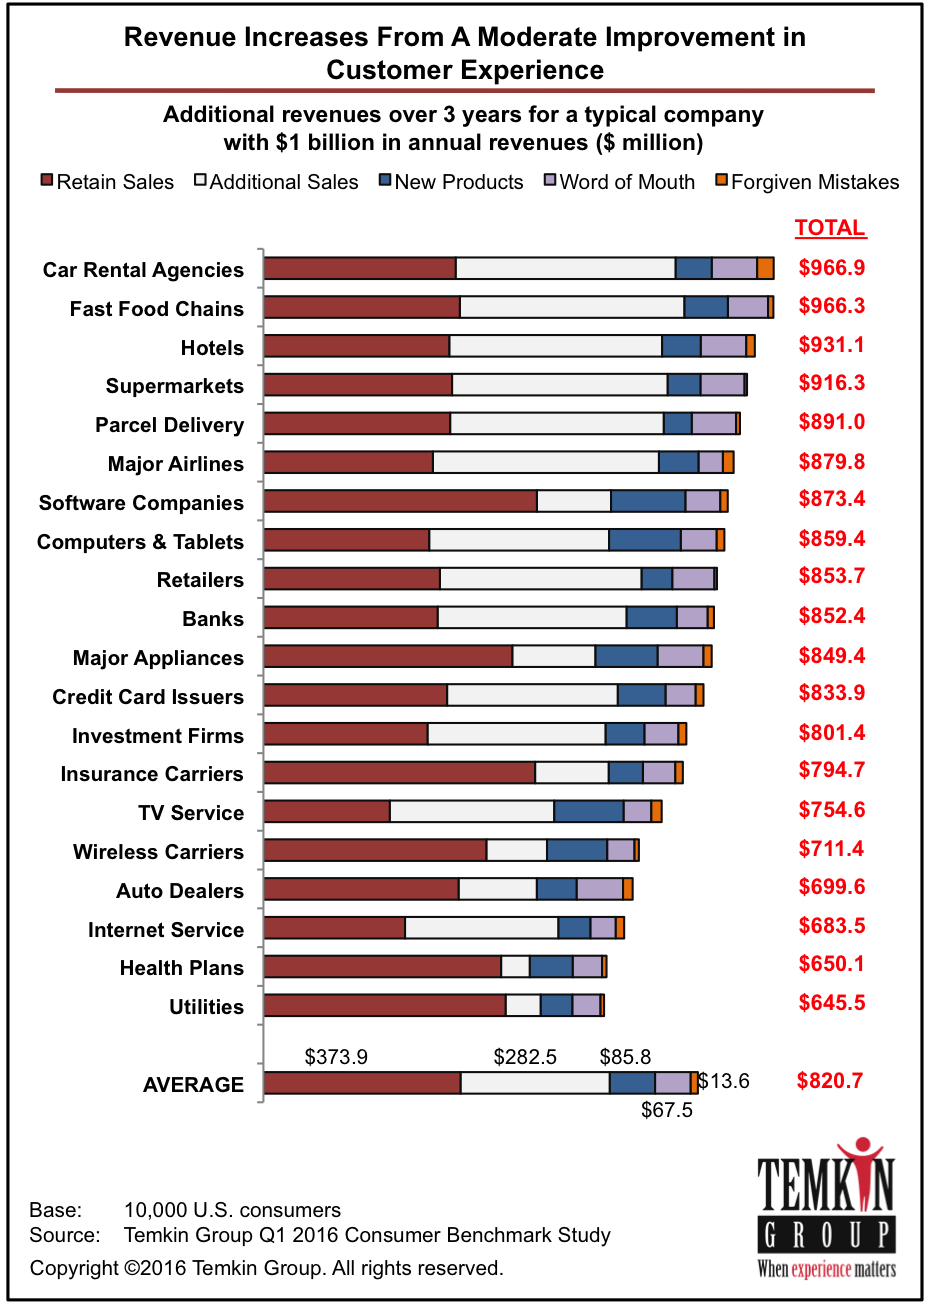
To understand the connection between customer experience (CX) and loyalty, we examined feedback from 10,000 U.S. consumers that describes both their experiences with and their loyalty to different companies. To examine the CX component, we used the 2016 Temkin Experience Ratings (TxR), which evaluated 294 companies. Our analysis shows that there’s a very large correlation between companies’ TxR and the willingness of customers to purchase more from them. This connection holds true for other areas of customer loyalty as well. We used this data to calculate the revenue impact of CX across 20 industries. We found that a moderate increase in CX generates an average revenue increase of $823 million over three years for a company with $1 billion in annual revenues. Rental car agencies have the most to gain from improving CX ($967 million), while utilities have the least to gain ($645 million). While all three components of customer experience¬—success, effort, and emotion—have a strong effect on loyalty, our research shows that emotion is the most important element. When compared with companies with very poor CX, companies with very good CX have a 16.7 percentage-point advantage in customers who are willing to purchase more from them, 16.7 percentage-point advantage in customers who trust them, 10.3 percentage-point advantage in customers willing to forgive them if they make a mistake, and 7.1 percentage-point advantage in customers who are willing to try their new products. Additionally, companies with very good CX ratings have an average Net Promoter Score that is 22 points higher than the scores of companies with poor CX. We recommend that you build your own CX ROI models, using our five-step approach for guidance.
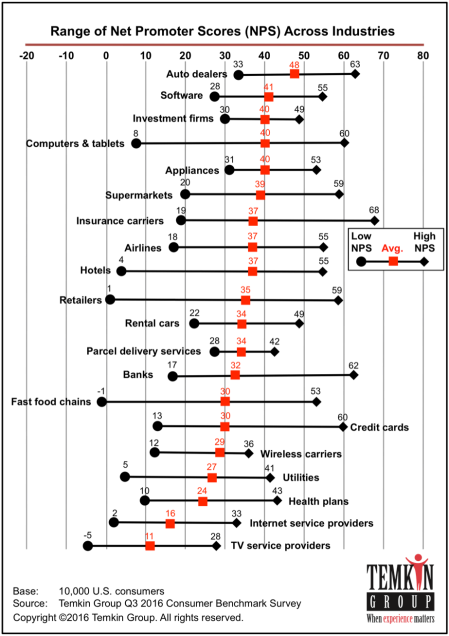
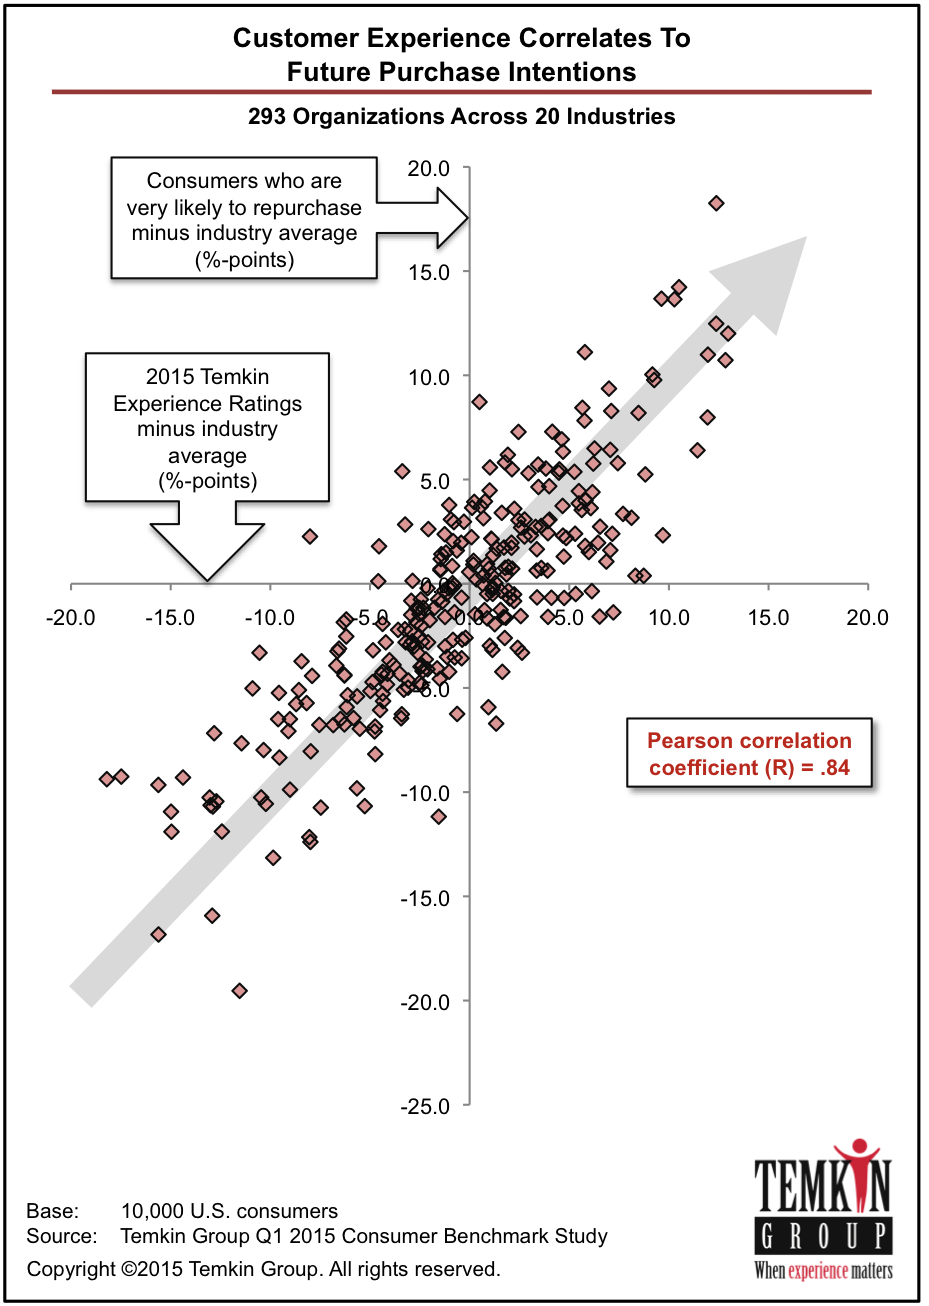
This is one of the figures in the report, and it shows the high correlation between Temkin Experience Ratings (customer experience) and purchase intentions for 294 companies across 20 industries:
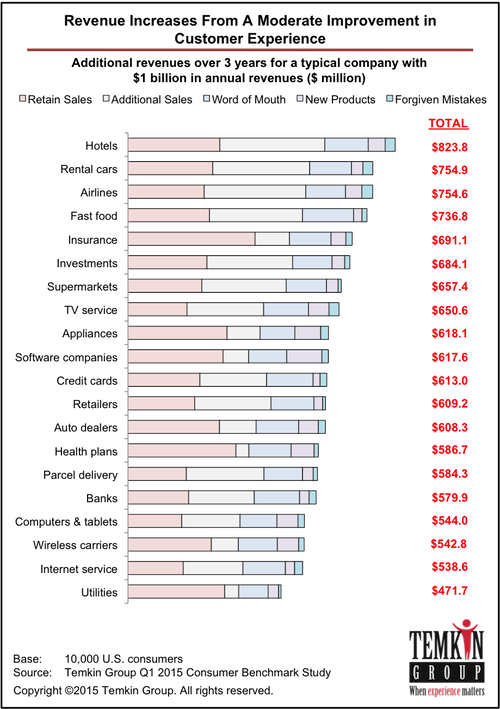
 Here’s an excerpt from the graphic showing the three year impact on revenues for a $1 billion company in 20 different industries:
Download report for $295
![]()
To see the customer experience levels of all 294 companies, download to the free 2016 Temkin Experience Ratings report.
P.S. Net Promoter Score, Net Promoter, and NPS are registered trademarks of Bain & Company, Satmetrix Systems, and Fred Reichheld.