Report: Tech Vendor NPS Benchmark, 2015 (B2B)
September 16, 2015 14 Comments
 We just published a Temkin Group report, Tech Vendor NPS Benchmark, 2015, The research examines Net Promoter Scores and the link to loyalty for 62 tech vendors based on feedback from IT decision makers in large North American organizations. We also compared overall results to our benchmarks from the previous three years. Here’s the executive summary:
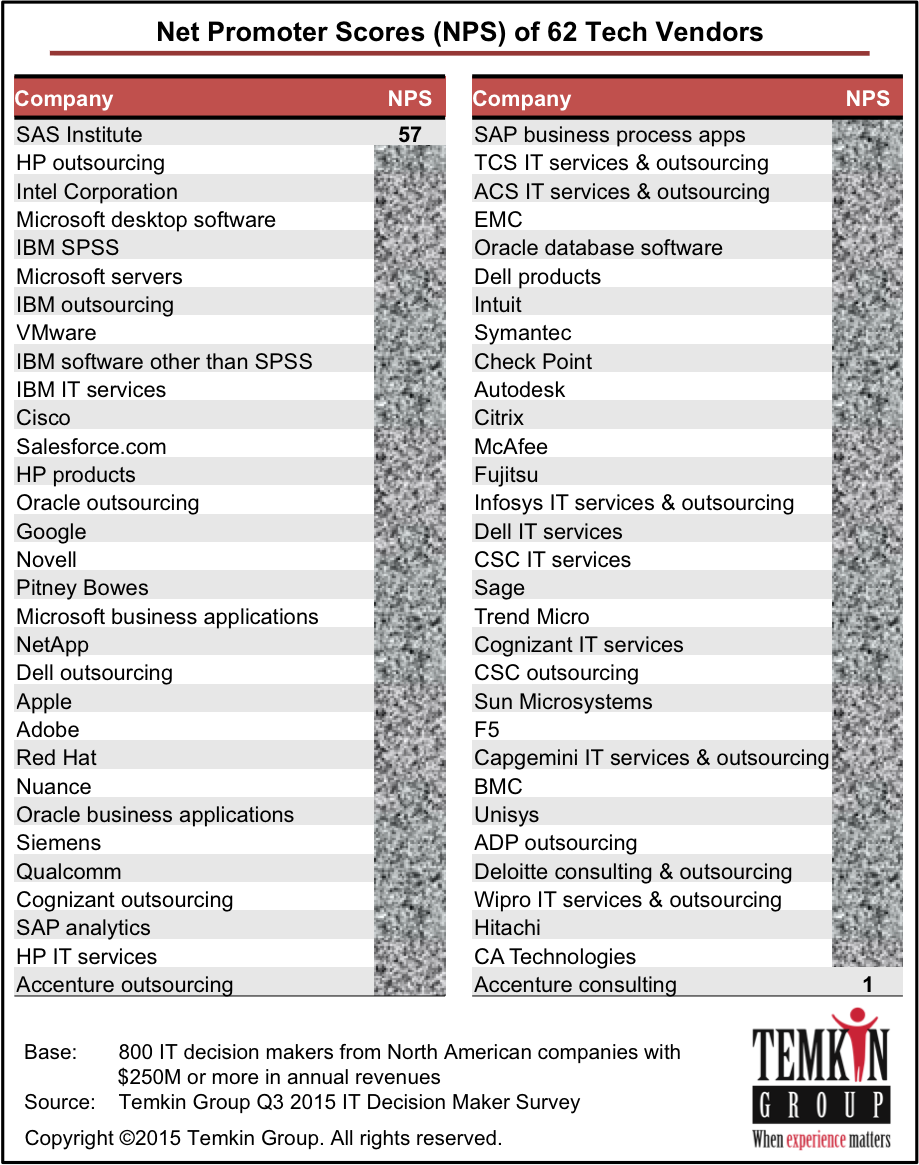
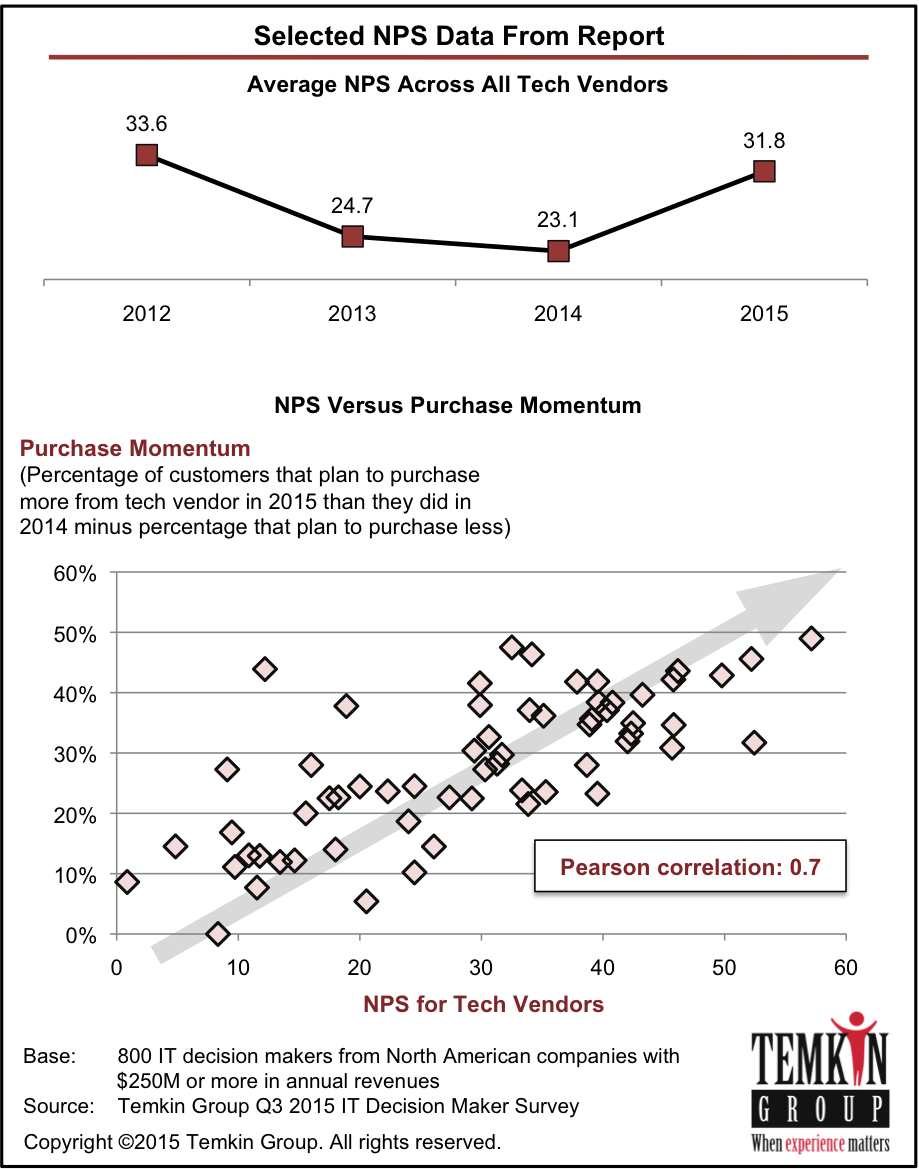
To examine the link between Net Promoter Scores® (NPS®) and loyalty, we surveyed 800 IT decision-makers from large North American firms to learn about their relationships with their technology providers. Of the 62 tech vendors we evaluated, SAS Institute, HP outsourcing, and Intel earned the highest NPS, while Accenture, CA Technologies, and Hitachi received the lowest. Overall, the tech vendor industry’s average NPS jumped to 31.8 in 2015—an increase of more than eight points—after two straight years of declining scores. Our analysis shows that promoters are much more likely than detractors to spend more money with tech vendors, try new products and services when they are announced, and forgive their tech vendors after a bad experience. Our results also revealed that SAS Institute and Cognizant outsourcing were the top companies for purchase momentum, IBM SPSS and Intel have the highest Temkin Innovation Equity Quotient, and HP outsourcing and Intel scored the highest in the Temkin Forgiveness Ratings.
The report includes graphics with data for NPS, purchase intentions, likelihood to forgive, and likelihood to try a new offering. The excel spreadsheet includes this data (in more detail) for the 62 companies as well as for 25 other tech vendors with less than 40 pieces of feedback. It also includes the summary NPS scores from 2014.
Download report for $695
(includes Excel spreadsheet with data)
![]()
As you can see in the chart below, the NPS ranges from a high of 57 for SAS Institute down to a low of 1 for Accenture consulting.
After declining for the past two years, the industry average NPS increased to 31.8 this year, almost reaching the level from our initial study in 2012. The research also includes data for Purchase Momentum (how much customers are planning to buy), Temkin Forgiveness Ratings (likelihood of customers to forgive after a bad experience), and Temkin Innovation Equity Quotient (likelihood of customer to try a new offering). We not only list the results for each company, but we also show that NPS is highly correlated to each of these items (as you can see below for Purchase Momentum).
Report details: When you purchase this research, you will receive a written report and an excel spreadsheet with more data. The report includes graphics with data for NPS, purchase momentum, Temkin Forgiveness Ratings, and Temkin Innovation Equity Quotient for the 62 tech vendors that had at least 40 pieces of feedback. The excel spreadsheet includes this data (in more detail) for the 62 companies as well as for 25 other tech vendors with less than 40 pieces of feedback. It also includes the summary NPS scores from 2014. If you want to know more about the data file, download this SAMPLE SPREADSHEET without the data (.xls).
Download report for $695
(includes Excel spreadsheet with data)
![]()
Note: See our 2014 NPS benchmark, 2013 NPS benchmark and 2012 NPS benchmark for tech vendors as well as our page full of NPS resources.
P.S. Net Promoter Score, Net Promoter, and NPS are registered trademarks of Bain & Company, Satmetrix Systems, and Fred Reichheld.

Will the details include the “one thing you could get these vendors to improve” (lower prices, improve products, improve support etc) as they did in 2013/14?
Vijay: We do not have the “one area to improve” in this year’s report…
Hello,
Do you capture the products the contacts are using when you capture the NPS?
Just as a heads up, there a quite a few mistakes in your excel spreadsheet download without data example. I would want to know if it were mine so figured I would pass it along (simple fixes like spelling mistakes and duplicate words).
Thank you.
Adam Cringle
Manager
Client Experience Intelligence
T +1 518 285 7044
Adam.Cringle@pb.com
pitneybowes.com
Pitney Bowes
One Global View
Troy, NY 12180
Hi Adam: Thanks for the feedback. We’ll clean up the spreadsheet. We do not ask the respondents about the specific products they are using.
How does an organization get included in the vendors surveyed? What are the requirements?
Diane: Temkin Group chooses the list of vendors in the study based on the size of the company, and our expectations that they will be large enough to garner the required sample size of respondents (40 or more) from our survey sample (800 large companies).
Thanks Bruce. Can we discuss if Appirio would meet those requirements? I believe we would.
Best, Diane
Just email me the details about your market share, in terms of number of large north american customers you have…
Are there any plans to do a report like this for Europe, I would be very interested to see that.
Regards Donna Quibell
Donna, unfortunately we do not have this type of report for Europe.
Do you have a report like this for Latam?
We do not currently have this data for Latam, or any market outside of the U.S.
These results are based on your own benchmarking survey, correct? Do you include stats and demograhics for the samples surveyed? Also, do you provide a free copy of the report to the companies included?
Hi Jane: Yes, the results are from our benchmarking survey. We do not provide any demographics beyond the fact that all respondents are IT decision-makers within North American organizations with at least $250M in annual revenues. We also do not provide free reports for any company, but… Cisco has a corporate subscription to our research and therefore you have access to the research. I’ll send you information on how to access the report in a separate email.