15 Top CX Posts From 2015

As the year comes to an end, I want to thank everyone who has been reading and sharing this blog. It’s a pleasure and an honor to be a part of your customer experience efforts, and I look forward to helping you drive even more success next year.

Before we move on to 2016, here are the 15 most-read posts from 2015:

  1. Seven Steps for Developing Customer Journey Maps
  2. Report: 2015 Temkin Experience Ratings
  3. Report: Net Promoter Score Benchmark Study, 2015
  4. 8 CX Trends for 2015 (The Year of the Employee)
  5. The Ultimate Customer Experience Infographic, 2015
  6. Don’t Confuse Customer Service With Customer Experience
  7. Free eBook: The 6 Laws Of Customer Experience
  8. 9 Recommendations For Net Promoter Score (NPS)
  9. Five Questions That Drive Customer Journey Thinking
  10. Report: Tech Vendor NPS Benchmark, 2015 (B2B)
  11. What is Customer Experience? (Video)
  12. Report: The Four Customer Experience Core Competencies
  13. Report: ROI of Customer Experience, 2014 (see updated 2015 version)
  14. 10 Customer Experience Factoids from 2014 (Infographic)
  15. Customer Experience Matters (The Video)

The bottom line: Good luck with your 2016 CX efforts!

Report: Make Your VoC Action-Oriented

1512_MakeYourVOCActionOriented_COVERWe published a Temkin Group report, Make Your VoC Action-Oriented. Here’s the executive summary:

Companies recognize that customer feedback and insights are critical for understanding customers, so they often create Voice of the Customer (VoC) programs as one of their first customer experience priorities. While most respondents within large organizations believe that these efforts have been successful, Temkin Group has found that an overwhelming number of VoC programs are still in very early stages of maturity. These immature programs overly focus on collecting feedback and don’t focus enough on driving action based on insights from the feedback. Our research shows that simplification is a key path to VoC maturity. This report identifies five strategies for simplifying VoC programs: Stakeholder Empathy, Tailored Insights, Feedback Rationalization, Loop-Closing, and Customer Journey Alignment. As companies adopt these five strategies, VoC teams must learn new skills and become research generalists, business consultants, compelling communicators, portfolio managers, and value creators.

Download report for $195
BuyDownload3

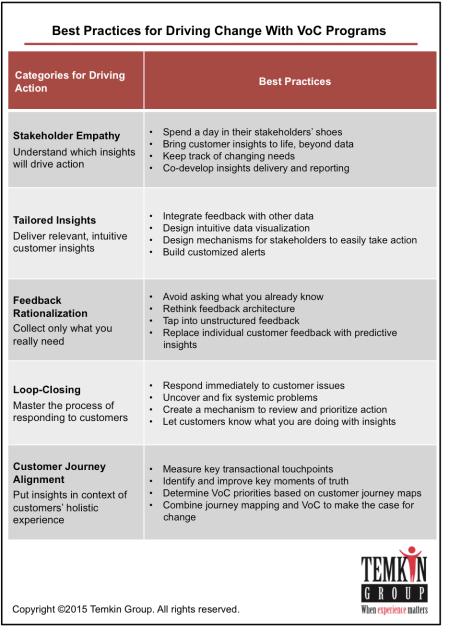
Here are the best practices we discuss in the report:

1512_ActionOrientedVoCBestPractices

Download report for $195
BuyDownload3

Tech Vendor Client Success Ratings

Are tech vendors helpful in making their IT clients successful? To answer that question, we surveyed 800 IT decision makers from North American companies with at least $250 million in annual revenues.

We asked the following question:

How helpful are these IT vendors in making sure that your organization successfully achieves its desired value from the products and services that you have purchased from them?

Responses are on a scale from 1 (not at all helpful) to 7 (extremely helpful).

Temkin Group created the Client Success Ratings (CSR), which is the percentage of respondents who answered 6 or 7. As you can see below, the average CSR is 61%.

1512_ClientSuccessRatings_Overall

Which tech vendors are the best and the worst? We examined client responses for 62 tech vendors and found that IBM software, Intel, IBM SPSS, and IBM outsourcing have the highest CSR. BMC, Deloitte, CSC and Cognizant have the lowest CSR.

1512_ClientSuccessRatings_Allb

You can purchase and download the dataset for $295.BuyDownloadThe dataset includes the detailed client success ratings for the 62 tech vendors listed in the graphic above.

Report: The State of CX Metrics, 2015

1512_StateOfCXMetrics2015_COVERWe published a Temkin Group report, The State of CX Metrics, 2015. This is the fifth year of this study that examines the CX metrics efforts within large companies. Here’s the executive summary:

Temkin Group surveyed nearly 200 large companies to learn about how they use customer experience (CX) metrics, and we then compared their answers with similar studies we’ve conducted every year since 2011. The most commonly used metrics continue to be likelihood-to-recommend and satisfaction, while the most successful metric is interaction satisfaction. And although the percentage of companies where senior leaders regularly refer to CX metrics has increased significantly from last year, fewer companies are making explicit trade-offs between CX metrics and financial metrics. Companies are best at measuring customer service and phone-based experiences and are worst at measuring the experiences of prospects and customers who defect. In addition to answering survey questions, we also had companies complete Temkin Group’s CX Metrics Competency and Maturity Assessment, which examines four areas of a metrics program: consistent (does the company use common CX metrics across the organization?), impactful (do the CX metrics inform important decisions?), integrated (are trade-offs made between CX and financial metrics?), and continuous (do leaders regularly examine the CX metrics?). Only 14% of respondents received at least a “good” overall rating, and companies earned the lowest rating in integrated. Ultimately, companies with stronger CX metrics programs deliver better customer experience, have stronger business results, more frequently measure ease of doing business, and compensate more employees based on CX metrics.

See the State of CX Metrics studies from 2011, 20122013, and 2014.

Download report for $195
BuyDownload3

Here are the results form our CX Metrics Competency & Maturity Assessment:

1512_CXMetricsAssessmentResults

Here are some other highlights of the research:

  • Forty-nine percent of companies with stronger CX metrics programs have well above average customer experience compared to 17% of those with weaker CX metrics programs. The stronger CX metrics programs are also 50% more likely to have significantly better business performance then their competitors.
  • While 64% of respondents rate their company as good or very good at collecting and sharing CX metrics, only 22% gave themselves those high marks when it came to making trade-offs between CX metrics and financial metrics.
  • Likelihood to recommend and satisfaction remain the most popular CX metrics, while companies are most successful in using satisfaction as a measure of specific customer interactions.
  • Seven out of 10 companies have compensation tied to CX metrics for some of their employees. Net Promoter® Score is the most common metric used and customer service is the most common group to have its compensation tied to CX metrics.
  • Companies are most effective at measuring customer service and phone interactions and least effective at measuring the experiences of prospects and customers who have defected.

Download report for $195
BuyDownload3

P.S. Net Promoter Score, Net Promoter, and NPS are registered trademarks of Bain & Company, Satmetrix Systems, and Fred Reichheld.

11 Customer Experience Trends for 2016 (The Year of Emotion)

WatchRecordedWebinarIt’s once again the time of year for me to publish my CX trends. In my post last year I named 2015 “The Year of Employee.” With this post, I’m declaring 2016 “The Year of Emotion.”

1512_CXTrends4In the upcoming year, CX will continue to grow in importance for companies and an even larger number of organizations will begin their CX journeys. In this environment, we expect to see:

  1. Culture Change Intensifying. WatchRecordedWebinarPeter Drucker once said, “Culture eats strategy for lunch.” We agree and believe that customer experience is a reflection an organization’s culture and operating processes. As you can see in our video Driving CX Transformation, customer-centric culture requires mastering four CX core competenciesPurposeful LeadershipCompelling Brand ValuesEmployee Engagement, and Customer Connectedness. We saw a surge of interest in the topic of culture in 2015, and we expect even more executives to begin the long-term journey of culture change in 2016.
  2. Effort Metric Expanding.WatchRecordedWebinar Every interaction has three components: Success, Effort, and Emotion. Companies have started to use versions of an “effort” score as a key CX metric, because it provides a good mechanism for identifying areas of improvement. We expect this trend to intensify, and for effort to become a more mainstream topic next year. See the 2015 Temkin Effort Ratings.
  3. Customer Journey Designing. WatchRecordedWebinarCustomer journey mapping has become one of the most popular CX tools as it helps provide a customer-oriented viewpoint. While many of these efforts have been heavily focused on isolated mapping events, we expect to see companies use the lessons from CJM to drive more decisions and changes across their organizations. As this happens, we recommend that more companies adopt what we call Customer Journey Thinking©.
  4. Mobile, Mobile, Mobile… Continuing. Mobile continues to become a more dominant interaction channel… and through increasingly varied types of devices. In 2016, we expect more companies to get beyond the basic level of making mobile-friendly websites and launching mobile apps. Organizations will rethink their offerings and operating processes, baking in assumptions that customers and employees are continuously connected.
  5. Speech Analytics Piloting. As companies get comfortable using text analytics and collecting customer insights from unstructured data, they often focus on their largest interaction dataset: contact center calls. While the technology has limited the use of speech analytics in the past, we believe 2016 will be the tipping point and expect to see a flutter of companies with speech analytics pilots.
  6. Predictive Analytics Personalizing.WatchRecordedWebinar As companies connect rich customer feedback with reams of CRM and operational data, the value of predictive modeling will rise exponentially. In 2016, we expect to see firms that have built data hubs over the last few years investing in predictive modeling and using the insights to develop a more personalized treatment of customers.
  7. Metrics to Action Realigning. WatchRecordedWebinarVoice of the customer programs (including NPS), are a mainstream component of most CX programs. But these efforts overly focus on collecting data at the expense of taking action on the insights. The problem stems from a desire to measure and track everything, which ends up consuming much of VoC teams’ capacity and budget. Next year we expect an increasing number of companies to shift their emphasis from tracking metrics to enabling action. As this occurs, they will lower their reliance on multiple-choice ratings scales to focus more on unstructured sources (comments, contact center interactions, etc.) and will increase their use of more qualitative techniques such as customer interviews and ethnography.
  8. Value-as-a-Service Emerging. As consumers get comfortable with companies like Uber and AirBnB and use more iTunes apps and cloud-based applications, they are being trained to pay for things as they need them. The notion of buying something that you may or may not use in the future is becoming outdated. In 2016, we expect this consumer behavior to push more companies to break apart their offerings into bite-sized pieces. As this happens companies will need to earn loyalty more frequently and ensure that customers get value from the things that they purchase.
  9. Employee CX & Empathy Training. WatchRecordedWebinarAs more companies roll out their CX change efforts, we expect to see them look for ways to train large groups of employees – to teach them basic CX concepts and to instill a sense of customer empathy. Why? Because more firms realize that sustainable CX success requires engaging employees — not simply introducing processes changes and expecting “blind” compliance. In 2016, the need for this training will grow rapidly, and CX professionals will respond by working with their training departments and outside consultants.
  10. CX Profession Maturing. WatchRecordedWebinarCustomer experience has come a long way over the last few years, as CX practitioners have shared lessons learned and improved upon best practices. Nothing illustrates this maturity better than the Customer Experience Professionals Association and the increasing number of Certified Customer Experience Professionals. As this trend continues, we expect to see CX professionals become more focused on helping their organizations achieve business and brand objectives. This will change their role from experts of tools to collaborators of change.
  11. Emotion Arising. WatchRecordedWebinarOur research shows that emotion is the component of customer experience that has the largest impact on loyalty, but it is also the area where companies are least adept and often seemingly ignore. Over the past few years, neuroscience and behavioral science research has begun to fuel new techniques for affecting human emotions. In 2016, we expect to see a major jump in the number of companies that discuss, measure, and design for emotion. It will also become a hot topic at CX conferences.

CXTrend_YearOfEmotion
The bottom line: Happy 2016, and enjoy the Year of Emotion!

Temkin Experience Ratings Explained (Video)

We created Temkin Experience Ratings (TxR) as an open standard for measuring and benchmarking customer experience. It is one of the Temkin Ratings (TemkinRatings.com). We provide free access to the ratings of hundreds of companies at the Temkin Ratings Website.

For more information about TxR, visit our Temkin Experience Ratings FAQs and watch this short video:

Temkin Ratings

Customer Experience Needs More Emotion (Infographic)

As the title of this post says, CX needs more emotion. If you like this infographic, then you can download this version in .pdf or download a 18″ x 24″ poster version).

1512_EmotionInfographic

The bottom line: Let’s put more emotion into CX!

Why CX Does Not Always Drive Loyalty

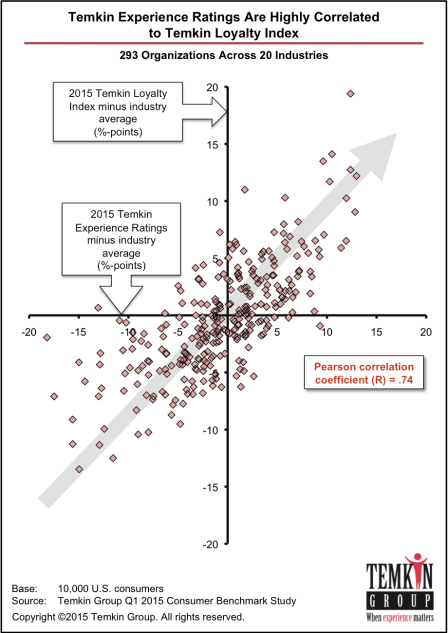
We recently published the Temkin Loyalty Index (TLi), which examines five areas of loyalty for 293 companies. So I looked at how that data related to the Temkin Experience Ratings (TxR) for those same companies. To normalize the data across industries, we compared company scores to the averages for their industries. As you can see below, there’s a very high correlation between the two.

1512_LoyaltyIndexTxR2

For most companies, their CX is fairly predictive of their loyalty. But this connection is not equally strong for all companies. We took a look at the outliers, the companies that have loyalty levels that are much stronger or much weaker than their CX would suggest.

1512_CXLoyaltyOutliers

Why is it that some companies have a much higher or lower loyalty than their CX would suggest? Here are some reasons:

  • Brand halo: Sometimes consumers’ view of a brand is stronger or weaker than would be supported by their experiences with the company. For some reason, there are emotional drivers that make consumers love or hate the company.
  • Loyalty latency. When consumers have an experience that is not reflective of their expectations for a company, they often treat it as an exception. So it can take time for consumers to recognize that a company’s CX has improved or declined, and to adjust their loyalty accordingly.
  • Switching costs. The harder it is for a consumer to move from one provider to another, the less effect bad CX will have on loyalty.
  • Perceived alternatives. The fewer direct replacements that a consumer thinks he/she has for a company’s product or service, the less effect bad CX will have on loyalty.

The bottom line: CX has a strong, but not complete effect on loyalty

Happy Giving Thanks to Customers

Whether or not you’re celebrating Thanksgiving, I hope that you have a wonderful day and take the time to give thanks for the many positive things in your life.

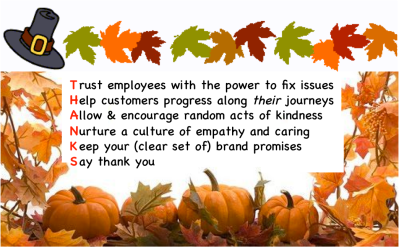
And while your being thankful, here are some ways to earn thanks from your customers:

1511_ThanksgivingThanks

Every Thanksgiving I also like to share this picture. It demonstrates how important it is to understand your audience and to consider the subtle elements of experience design.

Turkeys trying to fool blind man with an ax

The bottom line: Happy Thanksgiving!

Report: B2B Customer Experience Best Practices

1510_B2B CX Best Practices_COVERWe published a Temkin Group report, Business-to-Business (B2B) Customer Experience Best Practices. This report provides data on the state of customer experience (CX) in B2B as well as 20 CX best practices across five critical B2B processes. Here’s the executive summary:

Temkin Group research shows that although business-to-business (B2B) organizations are raising their customer experience (CX) ambitions, they still have a way to go before achieving their goals. Despite the fact that most large B2Bs have a low level of CX maturity, our research shows that 57% of them aspire to deliver industry-leading customer experience within three years. However, to improve their CX, B2Bs must master Temkin Group’s four customer experience core competencies: Purposeful Leadership, Compelling Brand Values, Employee Engagement, and Customer Connectedness. Our research uncovered 20 practices that B2Bs can emulate when applying those competencies across these five key business processes: sales and account management, implementation/project execution, support and issue resolution, partner alignment, and product management and innovation. To assess your organization’s CX maturity, use Temkin Group’s Customer Experience Competency Assessment and compare the results to data from other large B2B firms to chart your path to improvement.

Download report for $195
BuyDownload3

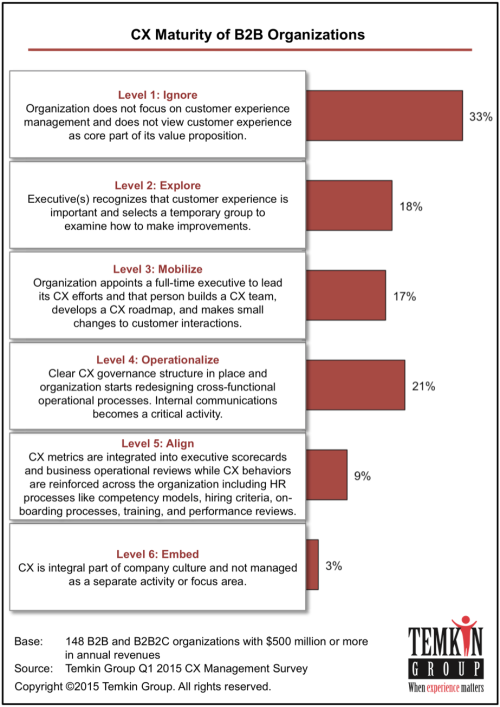
The report examines the state of B2B CX, including the results from large companies that completed Temkin Group’s CX Competency & Maturity Assessment:

1511_B2BCXMaturity

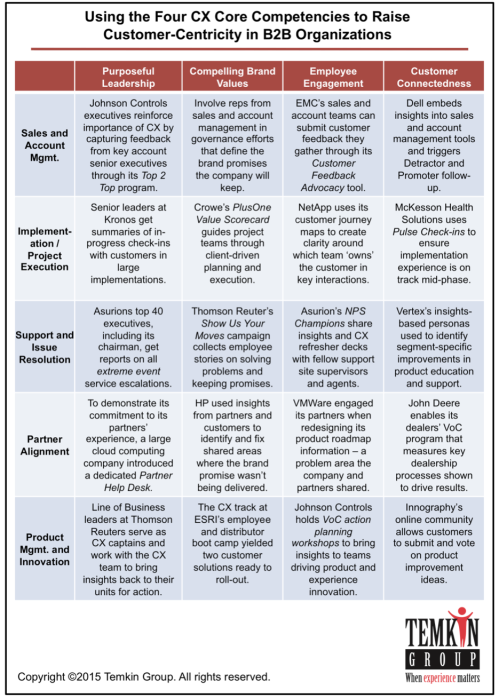
To help B2B organizations raise their CX maturity, we identify 20 best practices for mastering Temkin Group’s four customer experience core competencies: Purposeful Leadership, Compelling Brand Values, Employee Engagement, and Customer Connectedness. These practices are aligned with five key B2B activities: sales and account management, implementation/project execution, support and issue resolution, partner alignment, and product management and innovation:

1511_B2B5Processes

Download report for $195
BuyDownload3

Report: 2015 Temkin Loyalty Index

1511_TemkinLoyaltyIndex_COVERWe published a Temkin Group report, 2015 Temkin Loyalty Index. This report ranks the loyalty of consumers to 293 companies across 20 industries. Here’s the executive summary:

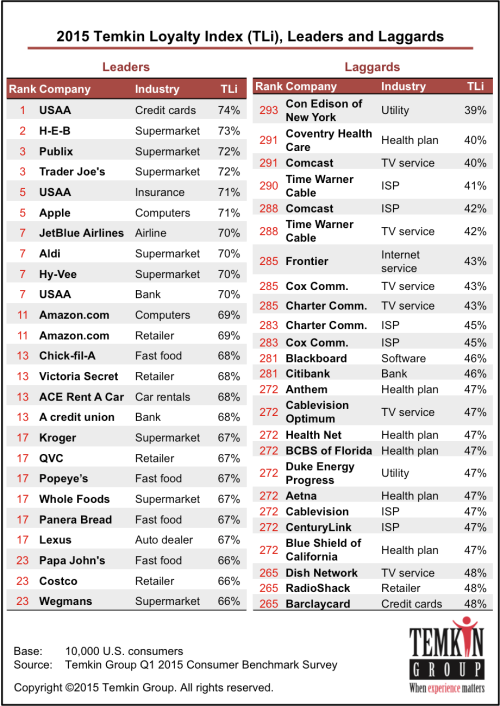
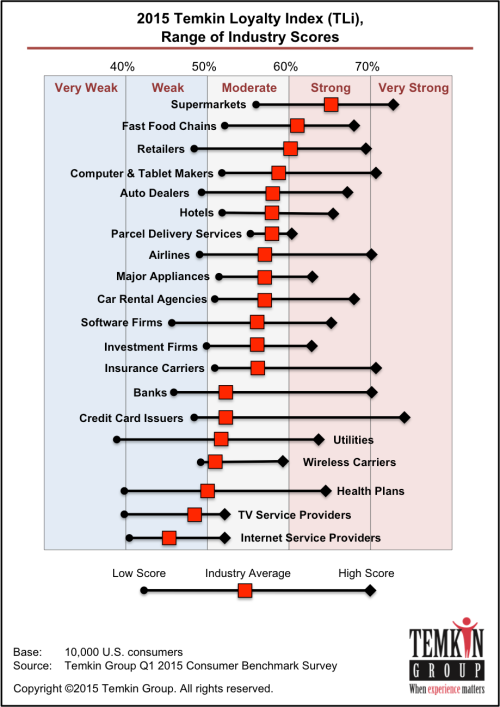
The 2015 Temkin Loyalty Index evaluates the loyalty of 10,000 U.S. consumers to 293 companies across 20 industries. The Index is based on evaluating consumers’ likelihood to do five things: repurchase from the company, recommend the company to others, forgive the company if it makes a mistake, trust the company, and try the company’s new offerings. Our research shows that USAA, H-E-B, Publix, and Trader Joe’s are at the top of the list when it comes to consumer loyalty, while Con Edison of NY, Coventry Health Care, Comcast, and Time Warner Cable are at the bottom. At an industry level, supermarkets, fast food chains, and retailers inspire the highest loyalty levels. At the other end of the spectrum, TV service providers and Internet service providers have the lowest levels of loyalty. USAA, JetBlue Airways, TriCare, credit unions, ACE Rent A Car, Apple, and Georgia Power have loyalty levels that most outperform their industry averages. Conversely, Con Edison of NY, RadioShack, Blackboard, Coventry Health Care, Citibank, Jeep, Bi-Lo, and McDonalds fall farthest behind their peers.

Download report for $395
(includes report plus dataset in Excel)
BuyDownload3

Here are the leaders and laggards as well as the industry scores:

1511_TLi_TopBottom

1511_TLi_IndustryRanges

Here are some other highlights of the research:

  • The Temkin Loyalty Index is an average rating across consumers’ likelihood to do five things:
    • Repurchase from the company
    • Recommend the company to others
    • Forgive the company if it makes a mistake
    • Trust the company
    • Try the company’s new offerings
  • At an industry level, supermarkets, fast food chains, and retailers have the highest loyalty levels. At the other end of the spectrum, TV service providers and Internet service providers have the lowest.
  • USAA (for credit cards, banking, and insurance), JetBlue Airways, TriCare, credit unions, ACE Rent A Car, Apple, and Georgia Power have loyalty levels that most outperform their industry averages.
  • Con Edison of NY, RadioShack, Blackboard, Coventry Health Care, Citibank, Jeep, Bi-Lo, and McDonalds fall farthest behind their peers.
  • The average likelihood to purchase across all industries is the highest (67%) while the average likelihood to try new offerings is the lowest (42%).
  • H-E-B and USAA lead, and Con Edison of NY lags in repurchase.
  • Aldi and Hy-Vee lead, and Coventry Health Care lags in recommendations.
  • USAA and ACE Rent A Car lead, and Con Edison of NY lags in forgiveness.
  • ACE Rent A Car leads, and Citibank and Citizens lag in new product loyalty.
  • Credit unions and H-E-B lead, and Comcast lags in trust.

Download report for $395
(includes report plus dataset in Excel)
BuyDownload3

If you want to know what data is included in this report and dataset, download this sample Excel dataset file.

Stop Surveying (And Ignoring) Your Customers

I just ran into a great (negative) example of my 6th CXtipDon’t waste customers’ time asking them questions unless you are prepared to act on what they say.

1511_TextMsgSurveyWe were on vacation at a very nice resort (the name of the resort is not relevant for my discussion). During our second day at the hotel, we received a text message that led to the interaction in the graphic on the right.

To summarize, we were asked to rate our experience on a scale of 1 to 10. We gave it a 7, and listed a number of problems that we had run into. We got back a text saying it was great to hear and asked us “what could we do next time to make sure your experience is excellent?

We said to read the previous text (with our list of problems) and we have not heard back since.

Here’s another way to tell this story.

Resort leader(s) decided that it was a good idea to survey its customers and get some data. Company asks customer to give a number. When it gets its number, the company sends back a standard question and ignores the response.

The results:

  • Customer feels ignored, lowering his overall experience.
  • Company sees this as a success… it has a number!

It’s Time To Stop Surveying Customers

Over the last few years, it seems as if masses of companies have decided to start “measuring” customer experience. They seem to view this as a strategy. It’s not!

Instead of surveying customers (which leads to these types of dysfunctional interactions), focus on improving customer experience. As I said in the CXtip above, don’t waste everyone’s time unless you are committed to making improvements.

Instead of surveying customers, ask customers questions that help you make their experiences better. And do something with what you learn.

The bottom line: Stop surveying, start improving.

Report: 2015 Temkin Experience Ratings of Tech Vendors

1511_TemkinExperienceRatingsTechVendors_FINALWe just published a Temkin Group report 2015 Temkin Experience Ratings of Tech Vendors that rates the customer experience of 62 large tech vendors based on a survey of 800 IT decision makers from large North American firms. This is the fourth year of the ratings, here are links to the 2012, 2013, and 2014 ratings.

Here is the executive summary of the report:

The 2015 Temkin Experience Ratings of Tech Vendors evaluates the customer experience of 62 large technology vendors. We surveyed 800 IT decision makers from large companies on the success, effort, and emotion components of their experiences with these IT providers. IBM SPSS and Intel earned the top ratings, while Cognizant and BMC were at the other end of the spectrum with the lowest ratings. The average score this year, 59%, represents a six percentage-point increase over last year and is the highest score achieved since the ratings’ inception in 2012. Our research also shows that the Temkin Experience Ratings are strongly correlated with elements of loyalty, such as repurchasing, Net Promoter Score, innovation success, and forgiveness.

This product has a report (.pdf) and a dataset (excel). The dataset has the details of the 2015 Temkin Experience Ratings, including all three components, for the 62 tech vendors as well as data on customers’ likelihood to repurchase from the vendors, their 2015 Temkin Forgiveness Ratings, and their 2015 Temkin Innovation Equity Quotient. It also includes a summary of the 2014 Temkin Experience Ratings, likelihood to repurchase, and Temkin Forgiveness Ratings.

Download for $695, includes report (.pdf) and data file (.xls)
BuyDownload3

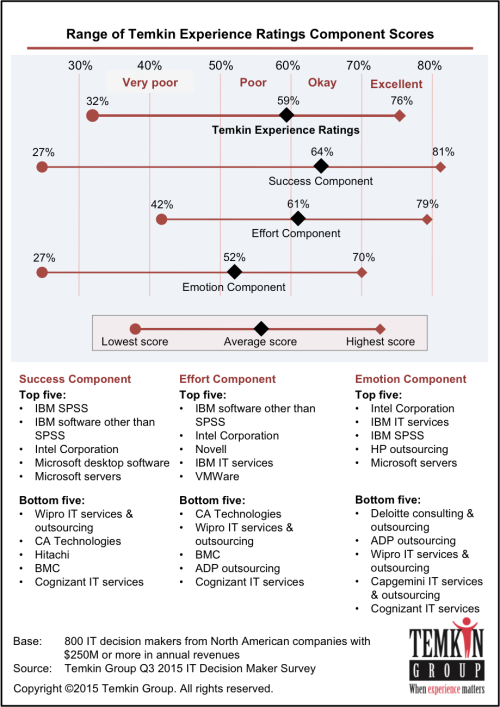
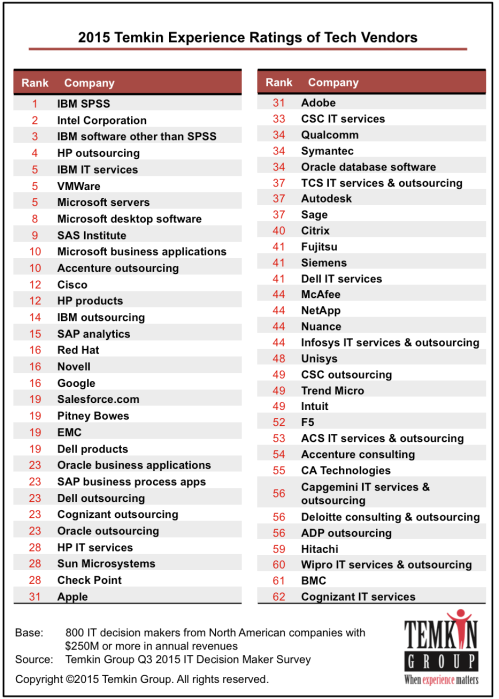
The Temkin Experience Ratings of Tech Vendors evaluates three areas of customer experience: success (can customers achieve what they want to do), effort (how easy is it for customers to do what they want to do), and emotion (how do customers feel about their interaction). Here are the overall results:
1511_TechVendorTxR_Rankings

1511_2015TxRTechVendorsRanges

Other highlights from the research:

  • The top seven firms earned “good” Temkin Experience Ratings, which is a score of 70% or higher. IBM SPSS topped the list with a score of 76%, followed by Intel Corporation with 74%, IBM Software (not SPSS), with72%, and HP Outsourcing with 71%.
  • The lowest rated tech vendor is Cognizant with a score of 32%, and it is the only company to earn a rating lower than 40%. Seven other firms have ratings of 45% or below: BMC, Wipro, Hitachi, ADP, Deloitte, Capgemini, and CA Technologies.
  • The average Temkin Experience Ratings across all of the tech vendors is 59%, which is jump from 53% last year. It is the also the highest level over the four years of the study.
  • Success has the highest average rating of 64%, effort is next at 61%, and emotion has the lowest rating, 52%.
  • The analysis shows a high correlation between technology vendors’ customer experience ratings and a number of areas of loyalty. Compared with companies in the bottom quartile of the ratings, tech vendors in the upper quartile have a 15 percentage point advantage in customers who are likely to repurchase from them, a 25 percentage point advantage in the number of customer who are likely to try a new offering right away, a 19 percentage pint advantage in customers who are willing to forgive them if they make a mistake, and a 31 point Net Promoter® Score advantage.

This product has a report (.pdf) and a dataset (excel). The dataset has the details of the 2015 Temkin Experience Ratings, including all three components, for the 62 tech vendors as well as data on customers’ likelihood to repurchase from the vendors, their 2015 Temkin Forgiveness Ratings, and their 2015 Temkin Innovation Equity Quotient. It also includes a summary of the 2014 Temkin Experience Ratings, likelihood to repurchase, and Temkin Forgiveness Ratings.

[Download sample of data file (.xls)]

Download for $695, includes report (.pdf) and data file (.xls)
BuyDownload3

Report: State of Voice of the Customer Programs, 2015

1510_StateOfVoCPrograms2015_CoverWe published a Temkin Group report, State of Voice of the Customer Programs, 2015. This is the fifth year that we’ve benchmarked the competency & maturity of voice of the customer programs within large organization. Here’s the executive summary:

For the fifth year, Temkin Group has benchmarked the voice of the customer (VoC) programs within large organizations. We found that while most organizations consider their VoC efforts to be successful, less than one-third of organizations actually believe they are good at making changes to the business based on these insights. Respondents think that the most important source of insights in the future will be customer interaction history, and they think that going forward, multiple-choice questions will be the least important. Respondents believe that technology will play an increasingly important role in their efforts, but the largest obstacle to VoC success remains integration across systems. In addition to asking questions about their VoC program, we also had respondents complete Temkin Group’s VoC Competency and Maturity Assessment, which examines capabilities across what we call the “Six Ds”: Detect, Disseminate, Diagnose, Discuss, Design, and Deploy. Although only 16% of companies have reached the two highest levels of VoC maturity, this is still an improvement from the 11% last year. When we compared high-scoring VoC programs with lower-scoring programs, we found that companies with mature programs are more successful, focus more on analytics, have more full-time staff, have more strongly coordinated efforts, and have more involved senior executives.

See the State of VoC reports from 201020112013, and 2014.

Download report for $195
BuyDownload3

Here are the results from Temkin Group’s VoC Competency & Maturity Assessment:

1510_VoCCompetencyMaturity

Download report for $195
BuyDownload3

100 Customer Experience Tips in 105 Characters (Or Less)

I’ve decided to take on a personal challenge: Tweeting (@btemkin) a new customer experience tip for 100 straight days.

100CXtips_v2After accounting for the overhead in each tweet (like links back to this post), I’m only left with about 105 characters. Hopefully I can keep up the pace and pack insight into that limited space. I’ll be using the hashtag, #CXtip, so you can follow me on twitter (or just keep coming back to this post).

The tips will cover the four customer experience core competencies: Purposeful Leadership (PL), Compelling Brand Values (CBV), Employee Engagement (EE) and Customer Connectedness (CC).

Here are the 100 #CX Tips:

  • #CXtip 1Examine #insights for #customers’ journeys, not for individual, siloed interactions. (CC)
  • #CXtip 2: Engaged employees are extremely valuable assets. They’re worth even more of your investment. (EE)
  • #CXtip 3: You can’t fake it. Assume that customers & employees will always figure out what’s real & act accordingly. (PL)
  • #CXtip 4: Great #brands are built on making, embracing & keeping promises, so be clear about your #customer promises. (CBV)
  • #CXtip 5: #CustExp encompasses success, effort, & emotion. They all impact loyalty, but #emotion rules. (CC)
  • #CXtip 6: Don’t waste customers’ time asking them questions unless you are prepared to act on what they say. (CC)
  • #CXtip 7: #Employees are more #engaged when you ask for their feedback and act upon what they say. (EE)
  • #CXtip 8: Build commitment by appealing to #employees’ hearts, shared values & intrinsic motivations. (PL)
  • #CXtip 9: Not all customers are the same. Stop treating them as if they are. Think of using #personas. (CC)
  • #CXtip 10: What people experience is not what they remember; so take advantage of how people remember things (CC)

Read more of this post