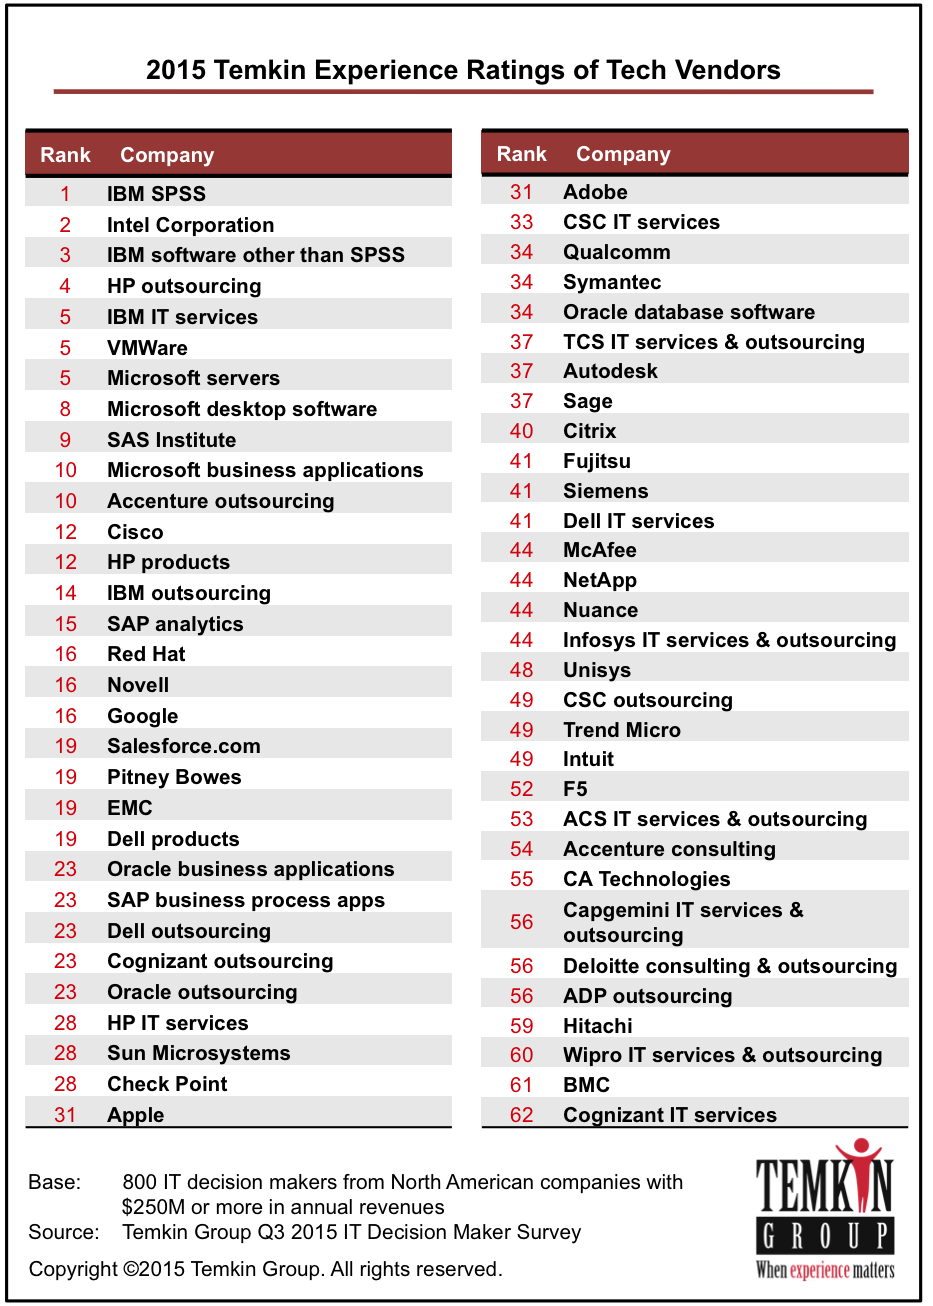
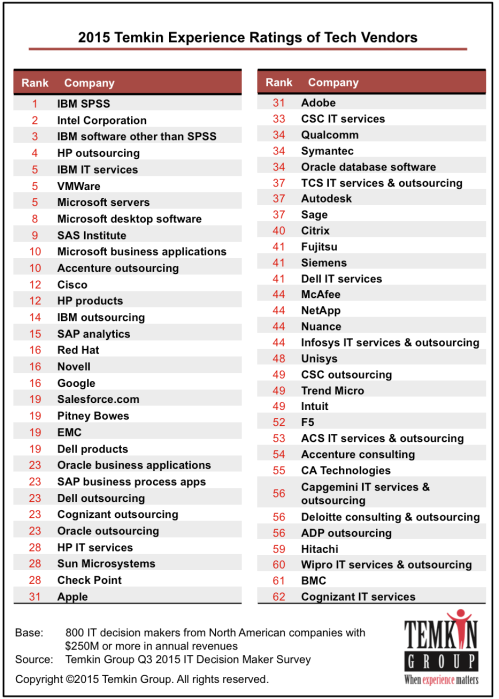
We just published a Temkin Group report 2015 Temkin Experience Ratings of Tech Vendors that rates the customer experience of 62 large tech vendors based on a survey of 800 IT decision makers from large North American firms. This is the fourth year of the ratings, here are links to the 2012, 2013, and 2014 ratings.
Here is the executive summary of the report:
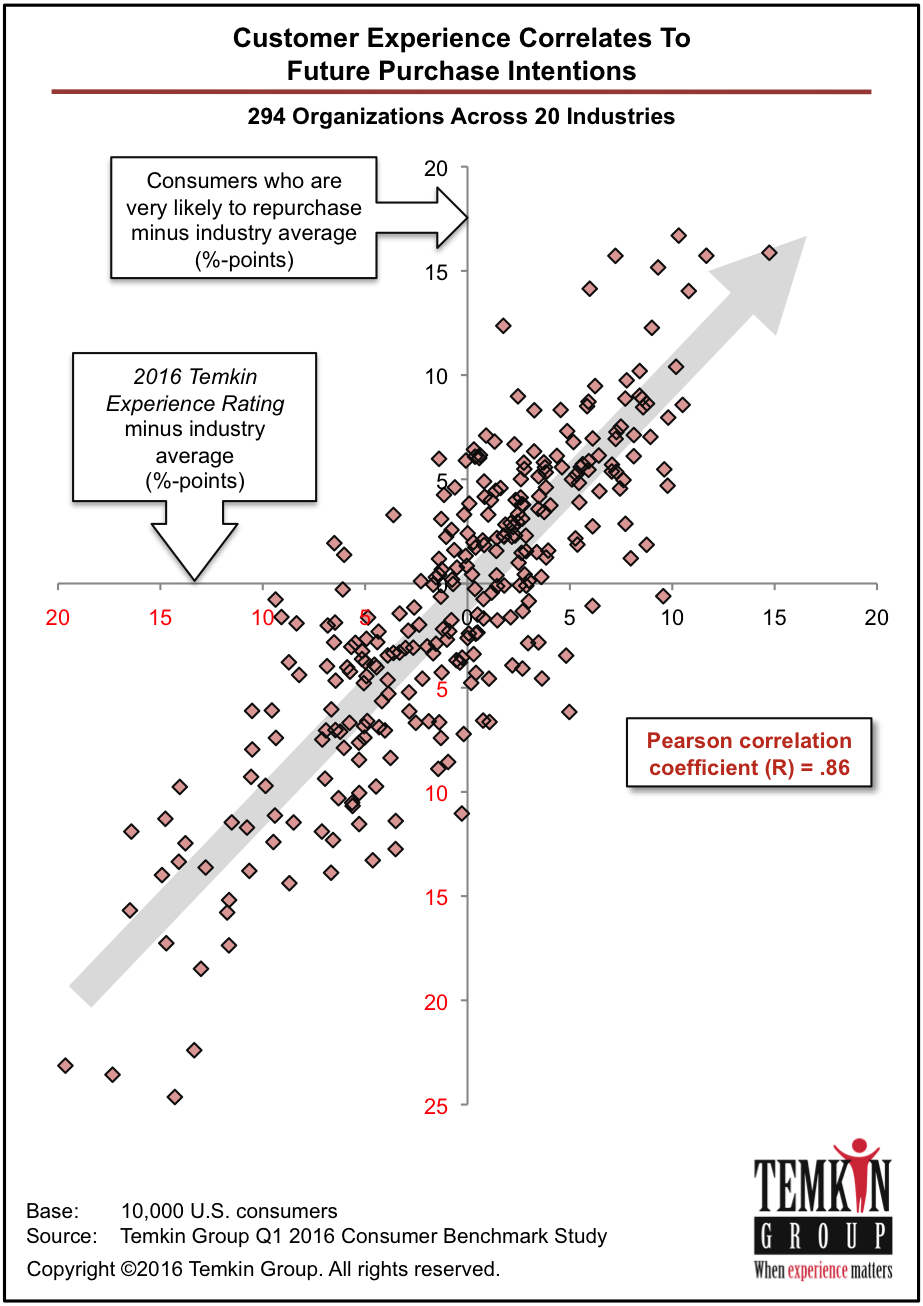
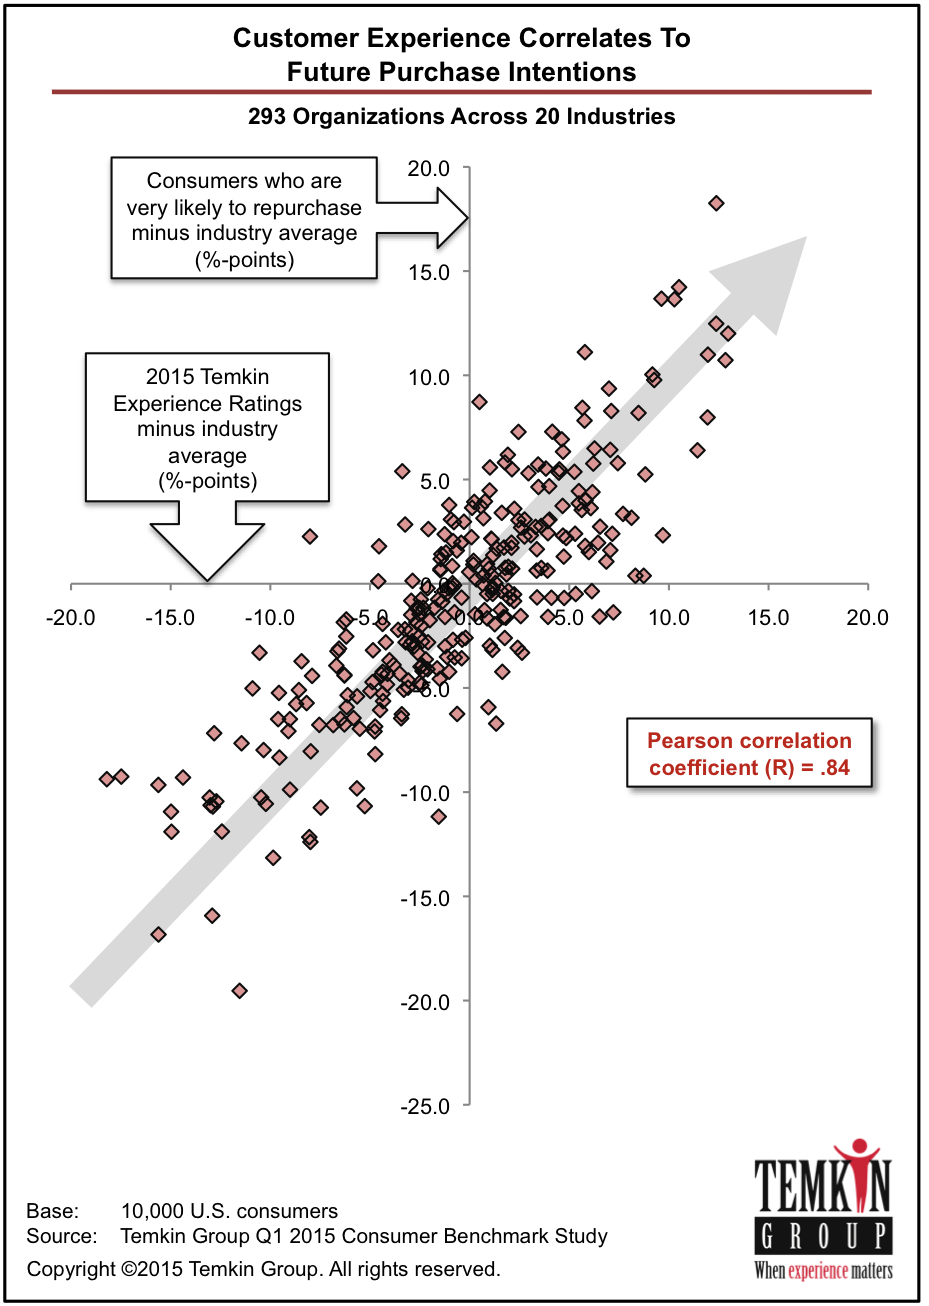
The 2015 Temkin Experience Ratings of Tech Vendors evaluates the customer experience of 62 large technology vendors. We surveyed 800 IT decision makers from large companies on the success, effort, and emotion components of their experiences with these IT providers. IBM SPSS and Intel earned the top ratings, while Cognizant and BMC were at the other end of the spectrum with the lowest ratings. The average score this year, 59%, represents a six percentage-point increase over last year and is the highest score achieved since the ratings’ inception in 2012. Our research also shows that the Temkin Experience Ratings are strongly correlated with elements of loyalty, such as repurchasing, Net Promoter Score, innovation success, and forgiveness.
This product has a report (.pdf) and a dataset (excel). The dataset has the details of the 2015 Temkin Experience Ratings, including all three components, for the 62 tech vendors as well as data on customers’ likelihood to repurchase from the vendors, their 2015 Temkin Forgiveness Ratings, and their 2015 Temkin Innovation Equity Quotient. It also includes a summary of the 2014 Temkin Experience Ratings, likelihood to repurchase, and Temkin Forgiveness Ratings.
Download for $695, includes report (.pdf) and data file (.xls)

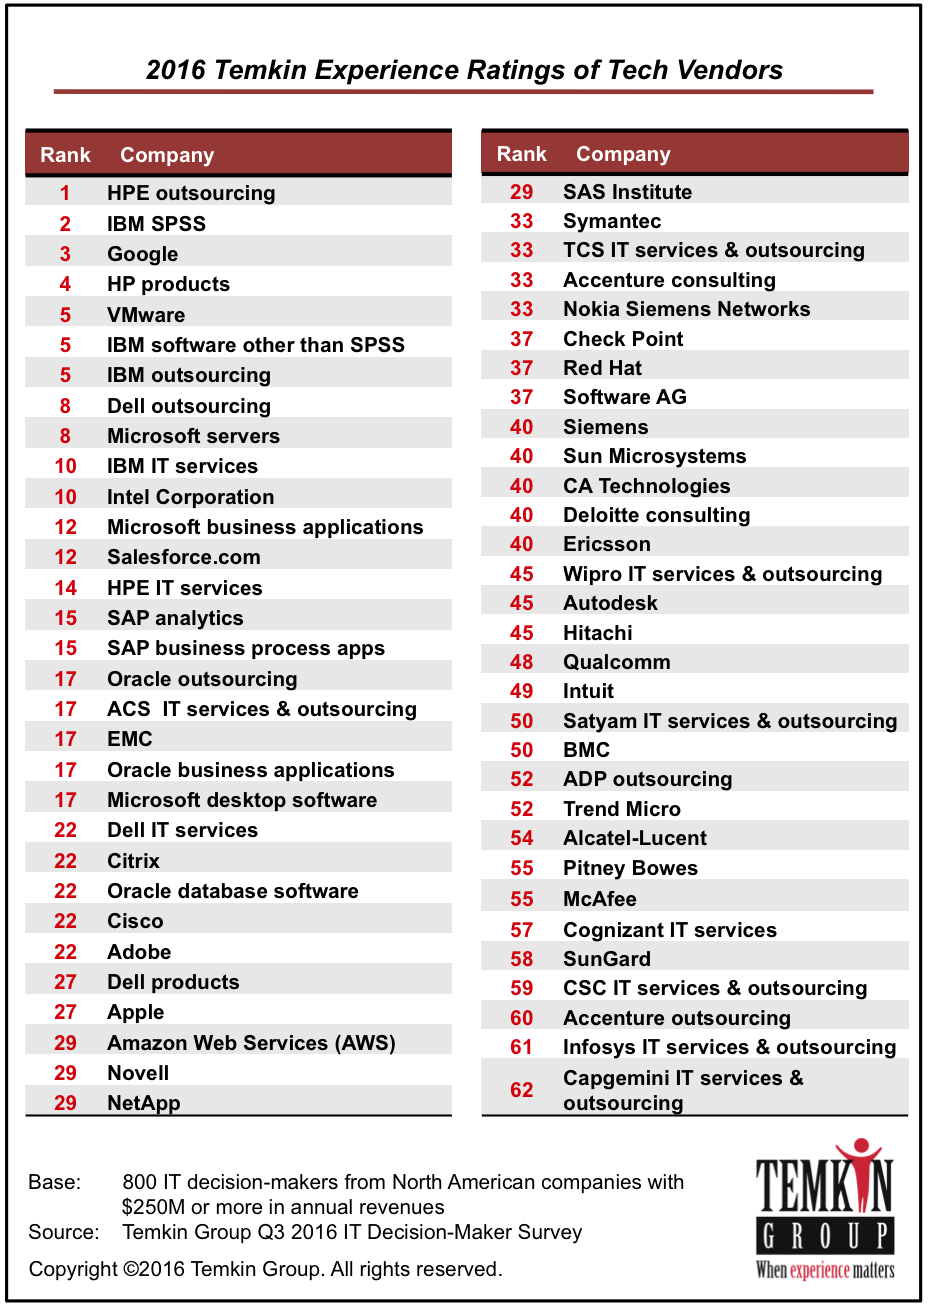
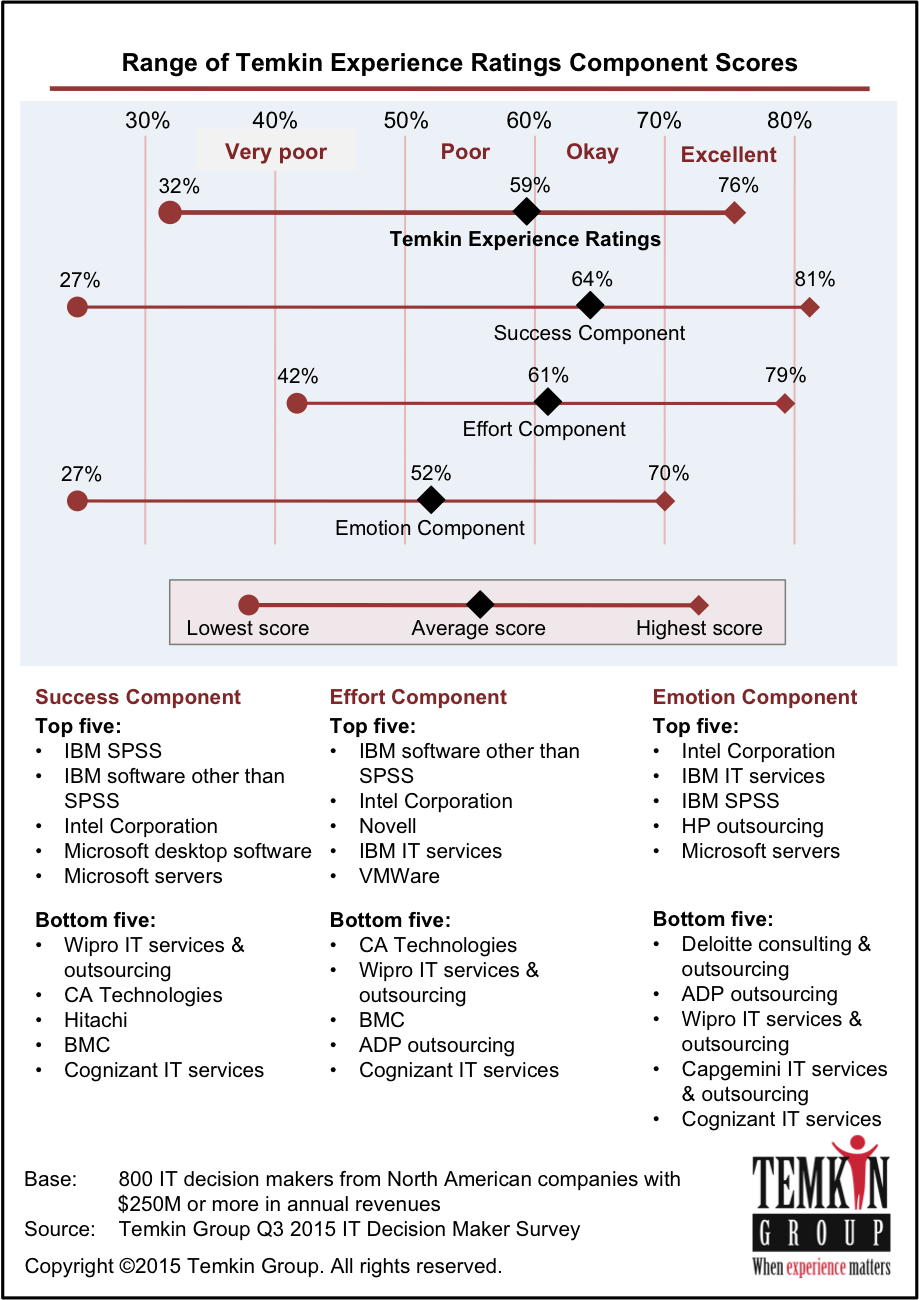
The Temkin Experience Ratings of Tech Vendors evaluates three areas of customer experience: success (can customers achieve what they want to do), effort (how easy is it for customers to do what they want to do), and emotion (how do customers feel about their interaction). Here are the overall results:
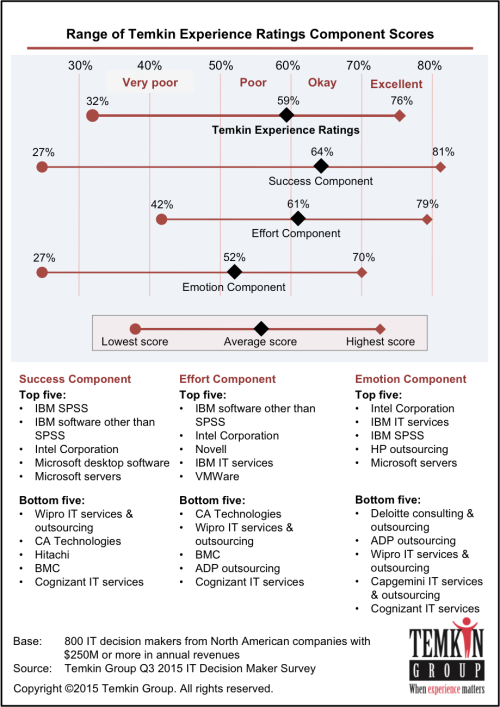
Other highlights from the research:
- The top seven firms earned “good” Temkin Experience Ratings, which is a score of 70% or higher. IBM SPSS topped the list with a score of 76%, followed by Intel Corporation with 74%, IBM Software (not SPSS), with72%, and HP Outsourcing with 71%.
- The lowest rated tech vendor is Cognizant with a score of 32%, and it is the only company to earn a rating lower than 40%. Seven other firms have ratings of 45% or below: BMC, Wipro, Hitachi, ADP, Deloitte, Capgemini, and CA Technologies.
- The average Temkin Experience Ratings across all of the tech vendors is 59%, which is jump from 53% last year. It is the also the highest level over the four years of the study.
- Success has the highest average rating of 64%, effort is next at 61%, and emotion has the lowest rating, 52%.
- The analysis shows a high correlation between technology vendors’ customer experience ratings and a number of areas of loyalty. Compared with companies in the bottom quartile of the ratings, tech vendors in the upper quartile have a 15 percentage point advantage in customers who are likely to repurchase from them, a 25 percentage point advantage in the number of customer who are likely to try a new offering right away, a 19 percentage pint advantage in customers who are willing to forgive them if they make a mistake, and a 31 point Net Promoter® Score advantage.
This product has a report (.pdf) and a dataset (excel). The dataset has the details of the 2015 Temkin Experience Ratings, including all three components, for the 62 tech vendors as well as data on customers’ likelihood to repurchase from the vendors, their 2015 Temkin Forgiveness Ratings, and their 2015 Temkin Innovation Equity Quotient. It also includes a summary of the 2014 Temkin Experience Ratings, likelihood to repurchase, and Temkin Forgiveness Ratings.
[Download sample of data file (.xls)]
Download for $695, includes report (.pdf) and data file (.xls)