Report: The Economics of Net Promoter
May 21, 2013 20 Comments

We just published a Temkin Group report, The Economics of Net Promoter, which examines the link between NPS and loyalty across 19 industries. Here’s the executive summary:
Net Promoter Score (NPS) is a popular metric, but how does it relate to loyalty? We analyzed responses from thousands of consumers and examined the connection between NPS and three areas of loyalty: likelihood to repurchase, likelihood to forgive, and the actual number of times they recommend a company. Compared to detractors, promoters are almost six times as likely to forgive, are more than five times as likely to repurchase, and are more than twice as likely as detractors to actually recommend a company. Examining the data, we also found that consumers who gave a score between 0 and 4 have particularly low levels of loyalty. The analysis examines 19 industries: airlines, appliance makers, auto dealers, banks, car rental agencies, computer makers, credit card issuers, fast food chains, grocery chains, health plans, hotel chains, insurance carriers, Internet service providers, investment firms, parcel delivery services, retailers, software firms, TV service providers, and wireless carriers. Promoters who are likely to repurchase range from 87% for grocery chains to 73% for TV service providers, those who are likely to forgive range from 72% for rental car agencies to 59% for TV service providers, and those who actually recommended a company range from 80% for retailers to 47% for parcel delivery services.
Download report for $295 (includes Excel dataset)
![]()
Here’s the first figure from the report. It has a total of 43 figures that include specific graphics for each of the 19 industries in the study.
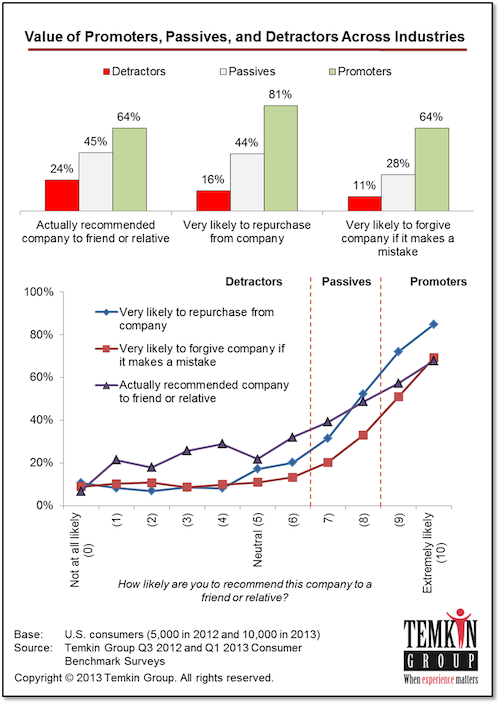
Here’s an excerpt from the first section that examines the data across all industries:
To understand how NPS relates to customer loyalty, we examined NPS scores for companies across 19 industries based on feedback from 10,000 U.S. consumers. The analysis covers more than 95,000 pieces of feedback from consumers about those companies. Examining three areas of loyalty across industries, looking at promoters versus detractors, we found that:
- Promoters are almost six times as likely to forgive. We asked consumers about their likelihood to forgive a company if it delivered a bad experience and found that 64% of promoters are likely to forgive compared with 11% of detractors.
- Promoters are more than five times as likely to repurchase. We asked consumers about their likelihood to make additional purchases from a company and found that 81% of promoters are likely to repurchase compared with 16% of detractors.
- Promoters are more than twice as likely as detractors to actually recommend. In a separate study of 5,000 U.S. consumers, we asked consumers how many times they actually recommended each company. It turns out that 64% of promoters have recommended the company compared with 24% of detractors.
We also examined the level of loyalty across each response on the NPS scale between 0 and 10. This analysis shows that:
- Super detractors are much less loyal. Forgiveness and repurchase loyalty stay at a consistent low level between 0 and 4 on the scale. Actual recommendations begin to increase after 5.
- Midpoint attracts low recommenders. When we examine the actual quantity of recommendations across the NPS scale it turns out that there’s significant drop in recommendations at the midpoint of the scale, when 5 is selected.
- Text anchors attract responses. We analyzed the volume of responses across the 11 point scale. Consumers appear to select the three responses with text anchors at a disproportionately high rate: “0,” “5,” and “10.”
Download report for $295 (includes Excel dataset) The Excel file provides all of the data from the 43 figures. Note: See our report, Net Promoter Score Benchmark Study, 2012 and the post 9 Recommendations For Net Promoter Score along with all of my other resources for NPS programs.
The bottom line: Promoters are more loyal than detractors.
P.S. Net Promoter Score, Net Promoter, and NPS are registered trademarks of Bain & Company, Satmetrix Systems, and Fred Reichheld.

Hi I’m a Director of Sales and Customer Experience in one of Australia’s leading providers of educationa learning experiences and qualifications. I have been in this organisation for 13 months and have sucessfully implemented NPS and a customer experience framework however my concern is your reporting doesnt point to any NPS benchmarking in the educational space / industry. Through the strategic marketing segmentation and research, we know there are at least 3.45 times throughout someones life when they need a qualification or short course so liklihood to repurchase and have loyalty is strong along with a strong word of mouth.. do you have anything on the educational sector and NPS, or am I doing some ground breaking stuff over here so to speak?
Hi Jonathan: We haven’t worked on customer experience with any educational institutions, so I am not familiar enough to say how unique your efforts may be. But my guess is that the only aggressive CX efforts in the states are in the for-profit institutions. Keep up the focus!
Jonathan: Bain & Company has worked with a variety of educational institutions (non-profit universities, for-profit educational institutions, charter schools, etc.) using the Net Promoter System. There are also training organizations using it, too. Feel free to reach out to us through our website. We haven’t published benchmark data, but we can at least give you a sense of what we’re seeing.
Hello, I am a marketing research executive, most recently led the Marketing Intelligence department for Time Warner Cable. I’m a fan of Net Promoter Score and can corroborate the findings in your report and go one step further. Tying customer behavior from the database directly to loyalty perceptions (NPS) proved categorically that those expressing high loyalty also spent more. I’m not sure if the report here includes actual buying behavior, and wondered if you proved that link. Doing so helps quantify the value of customer loyalty in dollars. It shows how much a 5-point improvement in NPS can bring to the topline.
Rachel: Our work with telecom players around the world bears this out, as well. Not only to promoters spend more on things like pay-per-view purchases or additional set top boxes, but they are also significantly more likely to become double-, triple- or quadruple-play customers. We published an article outlining some of these findings, which you can find here: http://www.bain.com/publications/articles/can-communications-service-providers-earn-customers-love.aspx.
Telephone, cable and wireless telecom providers in over a dozen markets around the world have found versions of exactly the same relationships to which you’re referring.
Nice teaser Bruce. Is there a perspective on whether respondents have had a recent experience with the company they rated, I.e how transactional is the data? This would be a significant factor when comparing industry sectors with recurring revenue streams (e.g. isp) against a sector characterised by once of purchases (consumer electronics).
Andrew: Hopefully this is more valuable than just a teaser 🙂
Good question. The data is a roll-up of consumer feedback on almost 300 companies. They were only surveyed about a company if they had interacted with it during the previous 60 days.
Very interesting Bruce, thanks for publishing! The industries seem to be more targeted to B2C…how applicable would these findings be for b2b companies?
Hi Sofia: These are totally B2C so it’s hard to extrapolate to B2B. We have another report going live next week with similar data in B2B for the Tech Industry. Stay tuned and thanks for sharing your thoughts.
Great thanks Bruce. Look forward to it!
Hey, looks nice report, is there included the telecommunication industry?
The analysis examines 19 industries: airlines, appliance makers, auto dealers, banks, car rental agencies, computer makers, credit card issuers, fast food chains, grocery chains, health plans, hotel chains, insurance carriers, Internet service providers, investment firms, parcel delivery services, retailers, software firms, TV service providers, and wireless carriers.
You list insurance carriers as one of the 19 industries. However, there is potentially a big difference between P&C and health insurance, where claims experience is not that uncommon, and life insurance. Can you tell me if the insurance industry data can be further subdivided by type of insurance company?
Hi Bob: Very good observation. We already have a separate category for health plans, but we should separate P&C from Life/Annuity/Retirement insurance. Clearly the data is skewed more towards P&C because many more consumers have experiences with these companies. The current data can’t really re-analyzed by these categories since there are some insurers who cut across both. We’ll try and break them apart in future studies.
Great job done Bruce. We are discussing your diagramm among UX profs in Russia.
Can you explain me one thing. Why % of “actually recomended” is higher than other responses inside detractors segment? It seems paradoxically that people wan’t forgive and repurchase but still have recommended brand. Maybe they made it befor they moved into detractors group? Thx for reply.
Andrei: It’s great to hear that you’e using our research. We haven’t yet dug deeply into the reasons why some detractors actually recommend the company. Some of it is likely caused by what you observed, they may have recommended before some event caused them to become a detractor. We also find that people aren’t really good forecasters of their own behavior. So even if they say they are likely or unlikely to recommend, that’s more of a transient attitude which may or may not reflect their actual longer-term behaviors.
Thx for replay Bruce.
I’m very inspired about this finding and will wait deeper insights about and more.
Rob,
Are you aware of any NPS scores that are public in the semiconductor industry manufacturers?
Terry Cain
Global Customer Engagement. Avnet Inc.
Hi!
Did you not include any other questions regarding customer satisfaction or loyalty in the study so that you could compare different questions and KPI´s? It would be a much more interesting study if it did. Show a greater comparison of KPI´s. As all the data shown here is just on intention and and past behaviour is tells us nothing about actual repurchase.
As been mentioned before the study show that even detractos recommend and that should be no surprise as grade 5 is the scale midpoint but still both 5 and 6 as seen as detractors. Even grade zero does not mean I would recommend againt it just means that you not at all likely to recommend and that is very different from recommend against. ForeSee ´s stydy found that NPS overestimates negative Word of mouth by 270 % on avarage.http://foreseeblog.com/2013/05/07/womi-the-next-generation-of-nps/
Hi Sven-Tore: Thanks for sharing your comments. We have a lot of data around many KPIs beyond NPS. This report, however, just dealt with NPS. We’ve examined many of the relationships you discuss in research and posts in this blog. There’s a lot of debate about NPS, but I’ve researched and worked with many companies that have made significant improvements by using NPS as part of an overall VoC program, and also seen many companies fail to make any improvements at all. The difference in success is almost never related to the efficacy of NPS as a metric.