Don’t Miss Our Upcoming CX Workshops
May 22, 2017

Connecting Brands, Leaders, Employees, and Customers
June 12, 2017 Leave a comment
Every organization makes some mistakes, so an important area of loyalty is the willingness of customers to forgive them. That’s why Temkin Group has been measuring forgiveness for several years in the U.S.
This year we’re publishing the 2017 Temkin Forgiveness Ratings, UK, which evaluates 157 companies across 16 industries based on a survey of 5,000 UK consumers in January 2017 (see full list of companies below). At the top of the ratings are Sony, Aldi, and Nationwide. At the bottom of the list are Audi, Bank of Scotland, and Airbnb.
You can see a summary of the results in the charts below, and you can also purchase the dataset with 2017 Temkin Forgiveness Ratings, UK for all 157 companies. And it also includes industry average Temkin Forgiveness Ratings across age groups.
Download dataset for $295 (see sample file)
![]()

June 7, 2017 Leave a comment
Temkin  Group announces the release of the 2017 Temkin Trust Ratings. Based on a study of 10,000 U.S consumers, the ratings benchmarks the level of trust that consumers have with 329 companies across 20 industries. H-E-B and Mercedes-Benz tied for the tops spots, followed closely by USAA (for banking and insurance), and Navy Federal Credit Union. Three TV/Internet service providers earned the lowest Temkin Trust Ratings: Time Warne Cable, Comcast, and Cox Communications. Eleven of the bottom 12 companies are either TV/Internet service providers or health plans. Here’s a list of all of the companies (.pdf).
You can see all of the high-level results on the Temkin Ratings website, or purchase a full dataset.
Purchase dataset for $295+
(see sample spreadsheet)


Highlights of the 2017 Temkin Trust Ratings include: Read more of this post
June 5, 2017 Leave a comment
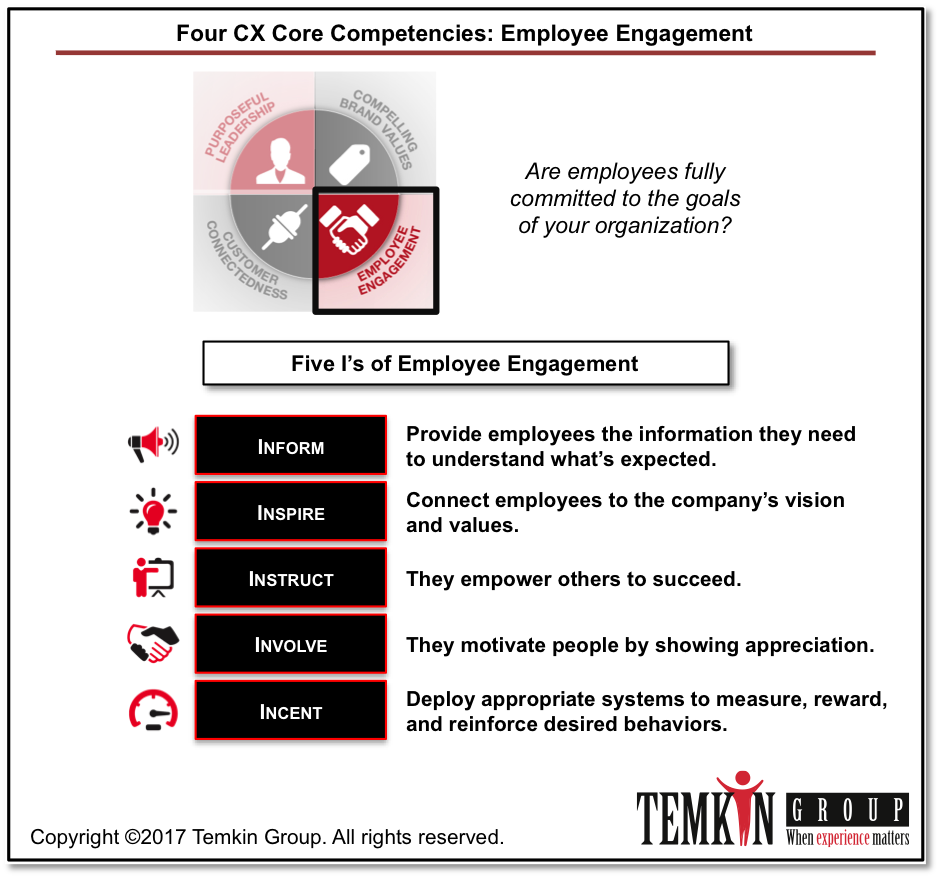
 We just published a Temkin Group report, Employee Engagement Competency & Maturity, 2017. Here’s the executive summary of this annual review of employee engagement activities, competencies, and maturity levels for large companies:
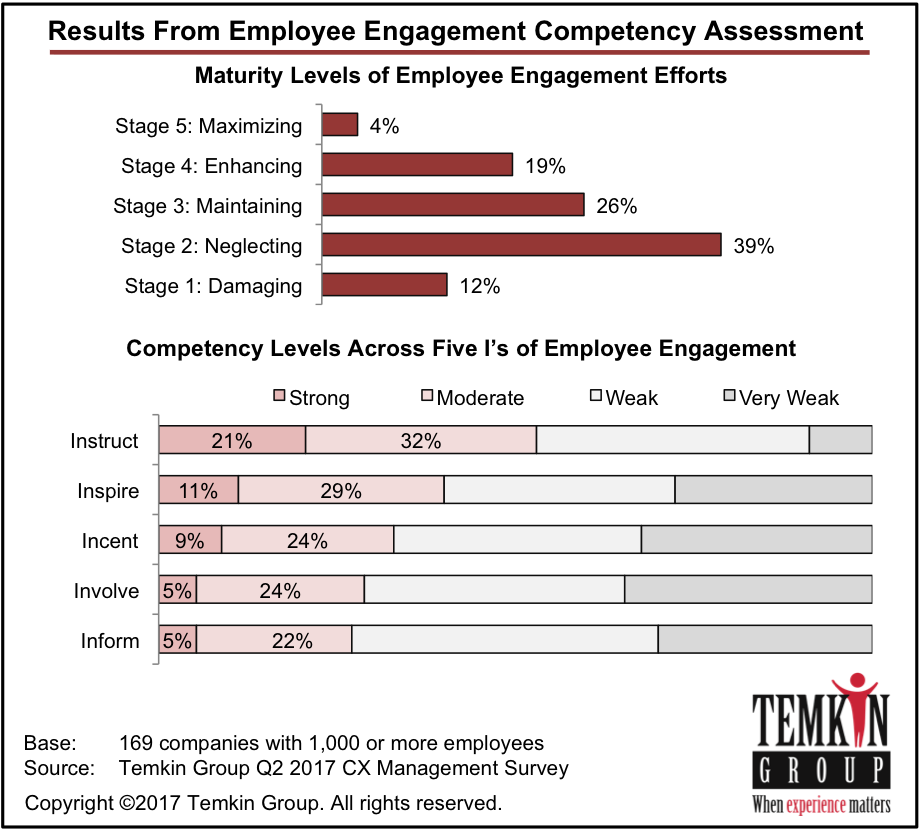
Engaged employees are critical assets to their organization. It’s not surprising, therefore, that customer experience leaders have more engaged employees than their peers. To understand how companies are engaging their employees, we surveyed 169 large companies and compared their responses with similar studies we’ve conducted in previous years. We also asked survey respondents to complete Temkin Group’s Employee Engagement Competency & Maturity (EECM) Assessment. Highlights from our analysis of their responses include:
Here’s an excerpt from one of the 17 graphics that shows the maturity levels of employee engagement efforts in large companies and their effectiveness across five employee engagement competencies: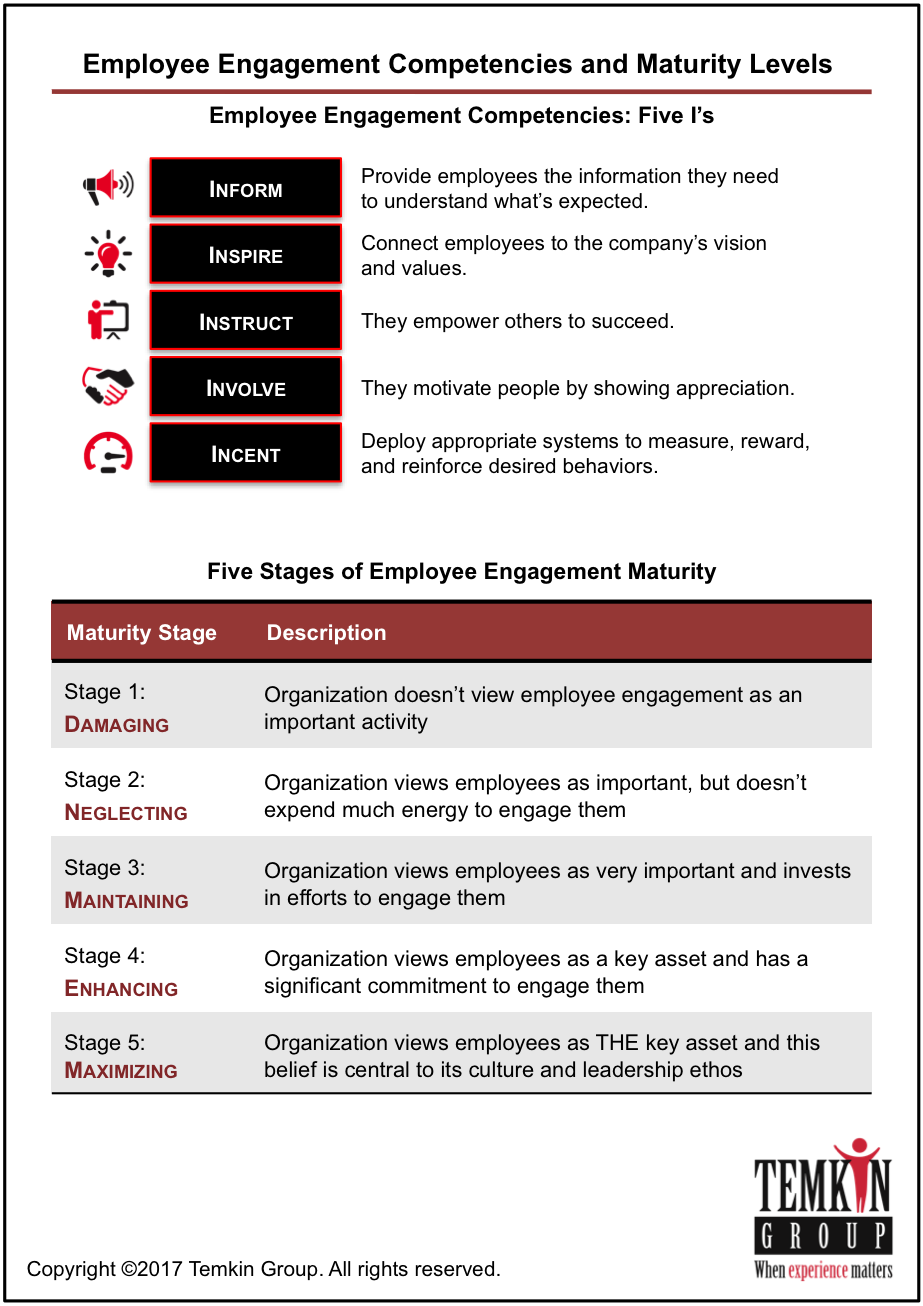
Download report for $195+![]()
June 3, 2017 Leave a comment
I recently read this quote attributed to President Trump:
Here, everything, pretty much everything you do in government involves heart, whereas in business most things don’t involve heart. In fact, in business you’re actually better off without it.
My take: No, no, no! This is wrong-minded, and very outdated thinking. To succeed, businesses must make emotional connections with customers, employees, and partners. The idea that success comes from being heartless promotes the debunked view that companies exist only to create value for shareholders. Here’s one of the points that I make in Modernized Leadership, which is an update to leadership theory:
Management focus has been driven by economists like Milton Friedman who argued that corporate officials have one core responsibility: making as much money as possible for their shareholders. But the value that a company creates comes from a combination of resources contributed by different constituencies (not just investors) who’s returns should also be maximized, especially employees who contribute their knowledge and skills.
POTUS is free to view his businesses as heartless entities that exist to increase his net worth. But I am hopeful that other leaders and emerging leaders don’t follow his lead. Even Jack Welch has rebutted the blind focus on shareholder value:
On the face of it, shareholder value is the dumbest idea in the world. Shareholder value is a result, not a strategy… Your main constituencies are your employees, your customers and your products.
If you’re a leader, than I hope that you focus on engaging the hearts and minds of your employees, customers, and partners. Creating value for an entire eco-system is more sustainable and rewarding than counting your profits.
The bottom line: Businesses need even more heart.
May 30, 2017 Leave a comment
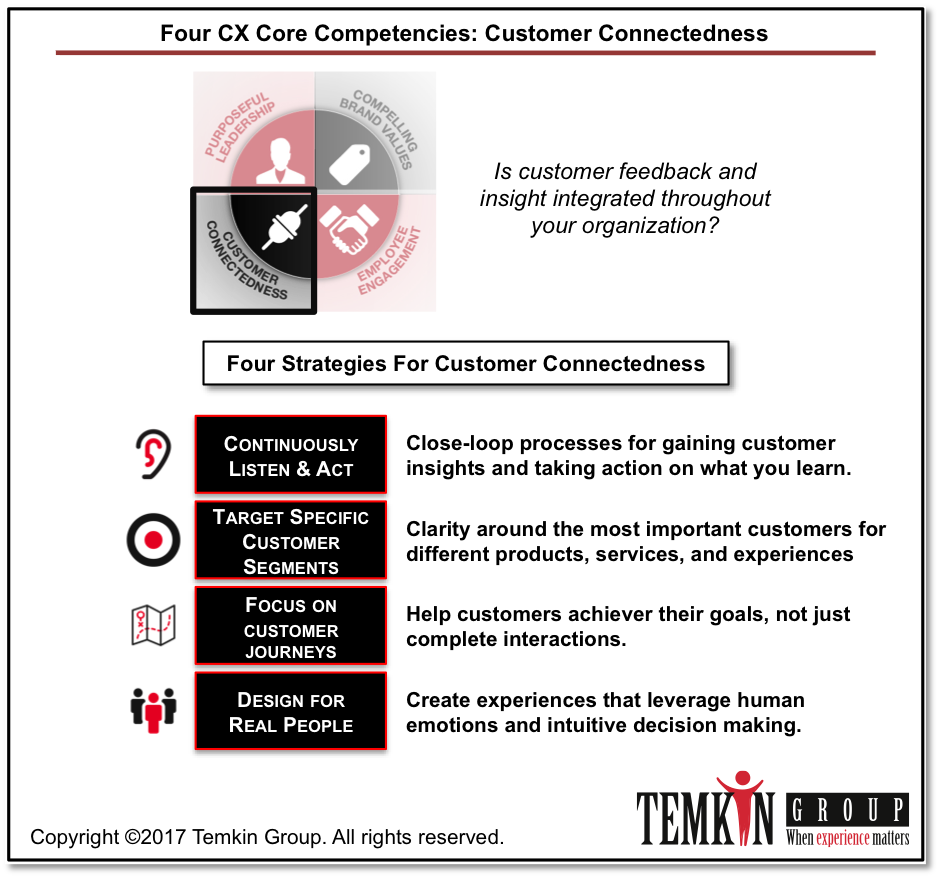
Temkin Group has found that the only path to sustainable customer experience differentiation is to build a customer-centric culture. How? By mastering Four Customer Experience Core Competencies.
This video provides an overview of one of those competencies, Customer Connectedness, where the goal is to infuse customer insight across the organization.
May 24, 2017 Leave a comment
Temkin Group has found that the only path to sustainable customer experience differentiation is to build a customer-centric culture. How? By mastering Four Customer Experience Core Competencies.
This video provides an overview of one of those competencies, Employee Engagement, where the goal is to align employees with the goals of the organization.
May 22, 2017 Leave a comment
In yesterday’s NY Times, there’s an excellent article, We Aren’t Built to Live in the Moment (written by Martin Seligman and John Tierney). It discusses how human beings process information, and the emergence of a new field called prospective psychology. Here’s a very simplified summary of what it says…
Human beings:
My take: First of all, we pay attention to whatever Seligman says; he’s the father of the Positive Psychology movement (see the post, Positive Psychology Meets Customer Experience). This view of human psychology describes that the brain as if it is constantly running a very advanced suite of predictive analytics. Here’s why this is meaningful for CX professionals:
And here’s why prospective psychology is important for everyone: it determines your happiness. Like any predictive model, it needs fine tuning. If your model is always calculating the worst-case outcomes, then you’ll tend to be sad and depressed. On the other hand, if your model is looking for positive scenarios, then you’ll stay happy and motivated. We’ll be following the research to see how people can adjust their personal predictive models.
The bottom line: Pay attention to prospective psychology.
May 16, 2017 Leave a comment
I’m very excited to announce the launch of the Customer Experience (CX) Institute…
 The CX Institute helps organizations become customer-centric. It provides leaders across your organization (from first-line supervisors to senior executives) with the knowledge, skills, & mindset required for an organization to become more customer centric.
 We developed our training to engage all levels of leaders, regardless how much they currently know about customer experience. It combines Temkin Group’s deep expertise in creating customer-centric organizations with leading-edge eLearning design techniques.
CX Institute will initially have two areas of offerings:
May 15, 2017 Leave a comment
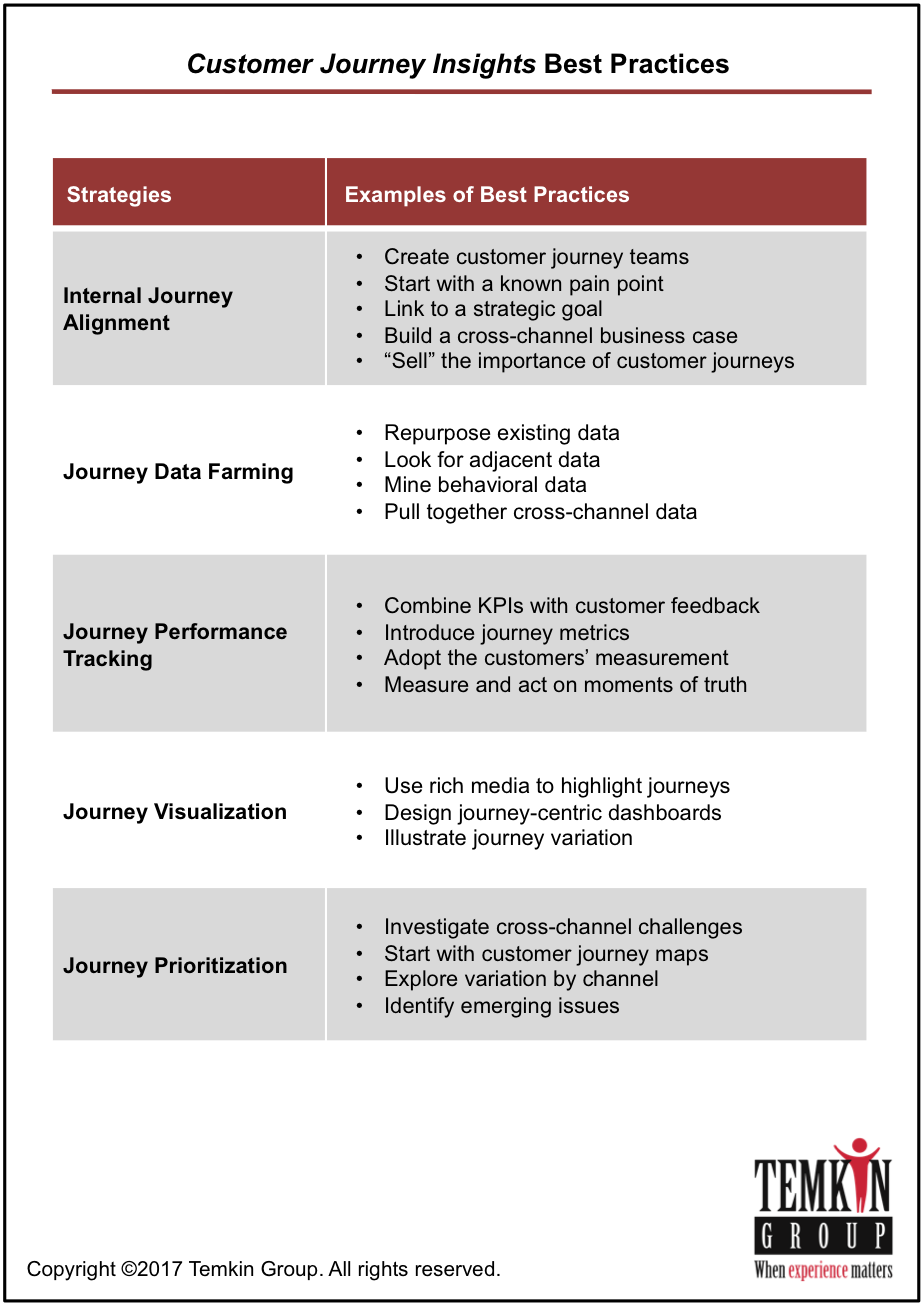
 We just published a Temkin Group report, The Shift To Customer Journey Insights. Here’s the executive summary:
Customer insights are critical to customer experience programs. However, current insights’ efforts tend to focus on individual interactions rather than on a customer’s entire journey, and as a result, they often fail to provide a complete picture of a customer’s experience with the company. This report helps companies shift their insights efforts from concentrating narrowly on single transactions to focusing broadly on customers’ journeys.
Here are some highlights :
Here are the best practices focused around five strategies for shifting towards customer journey insights:
May 10, 2017 Leave a comment
Temkin Group has found that the only path to sustainable customer experience differentiation is to build a customer-centric culture. How? By mastering Four Customer Experience Core Competencies.
This video provides an overview of one of those competencies, Compelling Brand Values, where the goal is to deliver on your brand promises to customers.

May 8, 2017 2 Comments
 We just published a Temkin Group report, What Happens After a Good or Bad Experience, 2017. This is our annual analysis of which companies deliver the most and least bad experiences, how consumers respond after those experience (in terms of sharing those experiences and changing their purchase behaviors), and the effect of service recovery (see last year’s report).
Here’s the executive summary:
To understand how good and bad experiences effect customer behavior, we asked 10,000 U.S. consumers about their recent interactions with more than 300 companies across 20 industries. We then compared results with similar studies we’ve conducted over the previous six years. Here are some highlights:
Here are excerpted versions of 3 (out of 19) graphics in the report:
Read more of this post
May 5, 2017 3 Comments
Comcast recently moved its Customer Service and Customer Experience teams into the company’s Technology and Products division. Charlie Herrin will remain as the chief customer experience officer and Tom Karinshak will remain as the chief customer service officer, but they will now both report into Tony Werner, president of Comcast’s Technology and Products Group.
Werner was quoted as saying
We are making these changes consistent with the guiding principles that have served us well – to move faster, minimize hand offs, reduce overlap and provide clear authority and accountability
My Take: Let me start off by saying that Comcast has little to lose with any reorganization of its customer experience efforts. The 2017 Temkin Experience Ratings show that Comcast continues to be one of the worst companies in the U.S. when it comes to customer experience.
But it’s fair to ask, will this move help or hurt Comcast’s customer experience in the future?
I am often asked about the impact that organizational structure has on customer experience. People want to know what the perfect reporting structure is for a customer experience team. Should it report into marketing? Into customer service? Directly into the executive team?
Actually, I don’t think it matters very much. I’ve seen companies drive successful change with the same organizational structure that led to failures in other companies. Rather than judging a customer experience effort based on how it lines up on a Powerpoint slide, I like to ask questions associated with these four Ps:
If the answer to all four of these is “yes,” then it’s a good organizational structure for the CX team. If any of the answers are “no,” then it’s not going to be successful.
I can’t answer these questions for Comcast, but we will be measuring its customer experience again next year. So we’ll see what happens.
The bottom line: When it comes to transformation, people trump structure.
May 3, 2017 1 Comment
Temkin Group has found that the only path to sustainable customer experience differentiation is to build a customer-centric culture. How? By mastering Four Customer Experience Core Competencies.
This video provides an overview of one of those competencies, Purposeful Leadership, where the goal is for leaders to act consistently with a clear, well-articulated set of values.

May 1, 2017 Leave a comment
 We just published a Temkin Group report, The State of CX Management, 2017.
For the eighth straight year, Temkin Group has evaluated the state of Customer Experience (CX) management at large companies. It includes a lot of details about customer experience within large organizations and examines their effectiveness across Temkin Group’s Four CX Core Competencies: Purposeful Leadership, Compelling Brand Values, Employee Engagement, and Customer Connectedness.
When we analyzed their efforts and their progress this year, we found that:
Here are the results from Temkin Group’s CX Competency & Maturity Assessment:

